1. Introduction
Diabetes mellitus (DM) is a chronic metabolic disorder characterized by persistent hyperglycemia resulting from defects in insulin secretion, insulin action, or both. It is one of the fastest-growing non-communicable diseases worldwide and poses a significant burden on healthcare systems due to its increasing prevalence and associated complications. Type 2 diabetes mellitus (T2DM), which accounts for approximately 90–95% of all diabetes cases, is primarily characterized by insulin resistance and progressive β-cell dysfunction. Chronic hyperglycemia leads to severe microvascular and macrovascular complications, including diabetic nephropathy, retinopathy, neuropathy, cardiovascular diseases, and stroke, significantly reducing patients' quality of life and increasing mortality[1,2]. Despite the availability of several classes of antidiabetic drugs, including metformin, sulfonylureas, thiazolidinediones, Dipeptidyl Peptidase-4 (DPP-4) inhibitors, Glucagon-Like Peptide-1 (GLP-1) receptor agonists, and Sodium-Glucose Cotransporter 2 (SGLT2) inhibitors, long-term therapy is often associated with adverse effects such as hypoglycemia, gastrointestinal disturbances, weight gain, hepatotoxicity, and declining therapeutic efficacy [³]. Therefore, the identification of novel molecular targets and safer therapeutic agents remains an important objective in diabetes research.
Protein Tyrosine Phosphatase 1B (PTP1B) has emerged as a promising therapeutic target for the treatment of type 2 diabetes and obesity because of its central role in the negative regulation of insulin signaling. PTP1B is a cytosolic non-receptor protein tyrosine phosphatase that dephosphorylates activated insulin receptors (IR) and insulin receptor substrate (IRS) proteins, thereby attenuating insulin-mediated signaling pathways. Increased expression or activity of PTP1B contributes to insulin resistance, impaired glucose uptake, and persistent hyperglycemia. Experimental studies have demonstrated that inhibition or genetic deletion of PTP1B enhances insulin sensitivity, improves glucose tolerance, reduces fasting blood glucose levels, and prevents obesity-related metabolic dysfunction. Consequently, selective PTP1B inhibitors are considered attractive candidates for the development of novel anti-hyperglycemic agents with improved therapeutic efficacy and reduced adverse effects [4-6].
Natural products have historically played a vital role in drug discovery because of their remarkable structural diversity and broad spectrum of biological activities. Among them, terpenoids represent one of the largest classes of naturally occurring secondary metabolites and have attracted considerable attention for their medicinal potential. Tricyclic terpenoids, including several diterpenoids and triterpenoids, exhibit a wide range of pharmacological activities such as anti-inflammatory, antioxidant, antimicrobial, antiviral, anticancer, hepatoprotective, and antidiabetic effects. Their rigid polycyclic scaffold, diverse stereochemistry, and multiple functional groups provide excellent opportunities for structural modification aimed at improving biological activity, target selectivity, and pharmacokinetic behavior. Several naturally occurring tricyclic terpenoids have demonstrated significant inhibitory activity against PTP1B, indicating their potential as lead molecules for the development of novel insulin-sensitizing drugs [7-9].
Advances in computer-aided drug design (CADD) have revolutionized the discovery and optimization of new therapeutic agents by reducing the time, cost, and experimental effort required during early drug development. Structure-based drug design techniques enable the rational identification of biologically active molecules through computational modeling of protein–ligand interactions. Among these approaches, molecular docking has become one of the most important computational tools for predicting the binding orientation, binding affinity, and interaction patterns of small molecules within the active site of target proteins. Docking simulations provide valuable information regarding hydrogen bonding, hydrophobic interactions, electrostatic interactions, π–π stacking, and van der Waals forces that contribute to ligand binding and enzyme inhibition [10,11].
In the case of PTP1B, molecular docking plays a crucial role in identifying molecules capable of occupying the catalytic pocket and interacting with key amino acid residues responsible for enzymatic activity. The technique enables virtual screening of large numbers of molecules, ranking them according to binding affinity, and identifying the most promising candidates before synthesis and biological evaluation. Furthermore, docking studies facilitate rational structural optimization by revealing the influence of different functional groups on protein–ligand interactions. Thus, molecular docking significantly accelerates the discovery of selective PTP1B inhibitors while minimizing experimental costs and improving the success rate of lead optimization [12,13].
Although biological potency is essential, successful drug candidates must also possess favorable pharmacokinetic and toxicological properties. A substantial proportion of molecules fail during clinical development because of poor absorption, limited bioavailability, rapid metabolism, inadequate tissue distribution, or unacceptable toxicity. Therefore, ADMET (Absorption, Distribution, Metabolism, Excretion, and Toxicity) prediction has become an indispensable component of modern drug discovery. In silico ADMET tools enable early evaluation of oral bioavailability, intestinal absorption, blood–brain barrier permeability, plasma protein binding, cytochrome P450 metabolism, renal clearance, hepatotoxicity, cardiotoxicity, mutagenicity, and overall drug-likeness. Early identification of molecules with favorable ADMET profiles substantially reduces late-stage failures and improves the efficiency of lead optimization [14,15].
Recent computational platforms, including SwissADME, pkCSM, ADMETlab, ProTox-II, and Molinspiration, have enabled rapid and reliable prediction of pharmacokinetic and toxicity parameters, allowing researchers to prioritize molecules with desirable safety and efficacy profiles before experimental validation. Integration of molecular docking with ADMET prediction provides a comprehensive computational strategy for identifying promising lead molecules by simultaneously evaluating target affinity and pharmacokinetic suitability. Such an integrated approach has become increasingly important in the discovery of novel antidiabetic agents targeting PTP1B [16,17].
The present study focuses on the design of novel tricyclic terpenoid derivatives as potential PTP1B inhibitors for the treatment of hyperglycemia associated with type 2 diabetes mellitus. Rational structural modifications are introduced into selected tricyclic terpenoid scaffolds to enhance binding affinity toward the catalytic site of PTP1B. Molecular docking studies are performed to investigate protein–ligand interactions, docking scores, and binding conformations, while comprehensive ADMET prediction is carried out to evaluate physicochemical properties, pharmacokinetic behavior, drug-likeness, and toxicity profiles. The integration of molecular design, docking analysis, and ADMET prediction is expected to facilitate the identification of potent, selective, and safe PTP1B inhibitors that may serve as promising lead molecules for the future development of effective anti-hyperglycemic therapeutics [18].
2. Materials and Methods
2.1 Materials
All chemicals and reagents used in the synthesis were of analytical reagent (AR) grade and were used as received without further purification, unless otherwise specified. The required starting materials, solvents, and reagents were procured from the Chemistry Laboratory of the university and commercial suppliers, including Chemdys Pvt. Ltd., Rajkot, India, and Sigma Pvt. Ltd., Mumbai, India.
2.2 Software and Tools
The 2D structures of the substituted tricyclic terpenoid derivatives were drawn using ChemDraw Ultra 8.0 and subsequently converted into 3D structures using Chem3D Ultra. Energy minimization was performed using MM2 (Molecular Mechanics 2) and MOPAC (Molecular Orbital Package) until a minimum RMS gradient value of 0.001 was achieved. The optimized structures were then used for the calculation of 3D molecular properties using Chem3D Ultra software developed by CambridgeSoft. Statistical correlation models between the dependent and independent variables were generated using the VALSTAT regression analysis program [18] Molecular docking studies were performed using the optimized 3D structures of the designed molecules and the target enzyme structure obtained from the Protein Data Bank (PDB) using Molegro Virtual Docker 6.0, developed by computerised life science (CLC) Drug Discovery Workbench [19].
The ADMET (Absorption, Distribution, Metabolism, Excretion, and Toxicity) and drug-likeness properties of the selected molecules were evaluated using the SwissADME web-based server [14]. The chemical structures of the selected molecules were initially converted into SMILES (Simplified Molecular Input Line Entry System) format and individually submitted to the SwissADME platform. The resulting predictions were used to assess their physicochemical properties, pharmacokinetic characteristics, drug-likeness, and other relevant medicinal-chemistry parameters.
2.3 Molecular Docking and Software Validation
Molecular docking is a computational approach used to investigate ligand–enzyme interactions and to predict the binding orientation of molecules within the active site of a target protein. In the present study, docking analysis was performed for 60 tricyclic terpenoid derivatives to investigate their binding interactions with amino acid residues associated with the antidiabetic activity of the target enzyme [20]. The docking protocol was validated by re-docking the co-crystallized ligand into its corresponding protein binding site and comparing its predicted orientation with the experimentally determined conformation. This validation was performed to assess the reproducibility and reliability of the docking procedure.
2.4 PDB Structure Selection
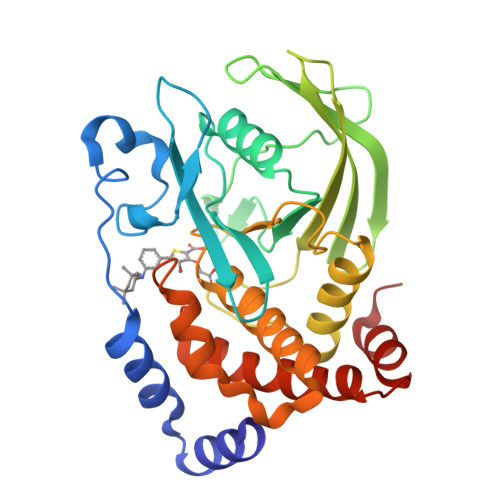
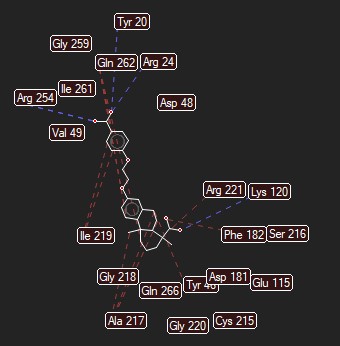
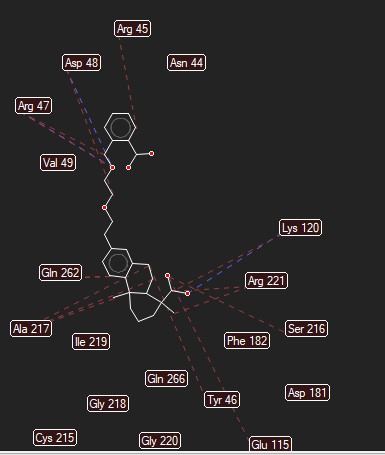
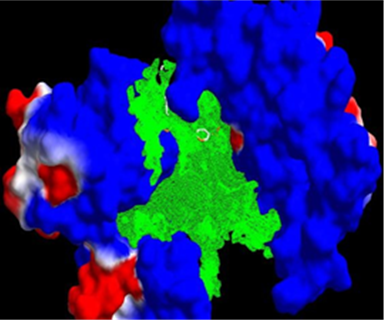
The crystal structure of PTP1B in complex with inhibitor 4B3 (PDB ID: 2QBQ) was selected as the target protein for the docking studies and structure description given in figure no.1 [21]. The protein is classified as a hydrolase and was obtained from Homo sapiens, with Escherichia coli used as the expression system. The co-crystallized ligand 4B3, chemically identified as 4-bromo-3-(carboxymethoxy)-5-{3-[(3,3,5,5-tetramethylcyclohexyl) amino]phenyl} thiophene-2-carboxylic acid, was used as the reference ligand. The presence of the co-crystallized inhibitor within the PTP1B active site provided a suitable structural basis for evaluating the binding modes and interactions of the designed tricyclic terpenoid derivatives [21]. A series of substituted tricyclic terpenoid derivatives (molecules 01–60) was designed through systematic modification of the R1, R2, and R3 positions and mention in figure no.2 and 3. The corresponding structural modifications are summarized in Table 1.
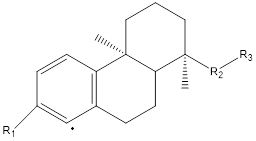
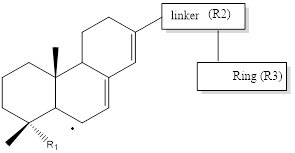
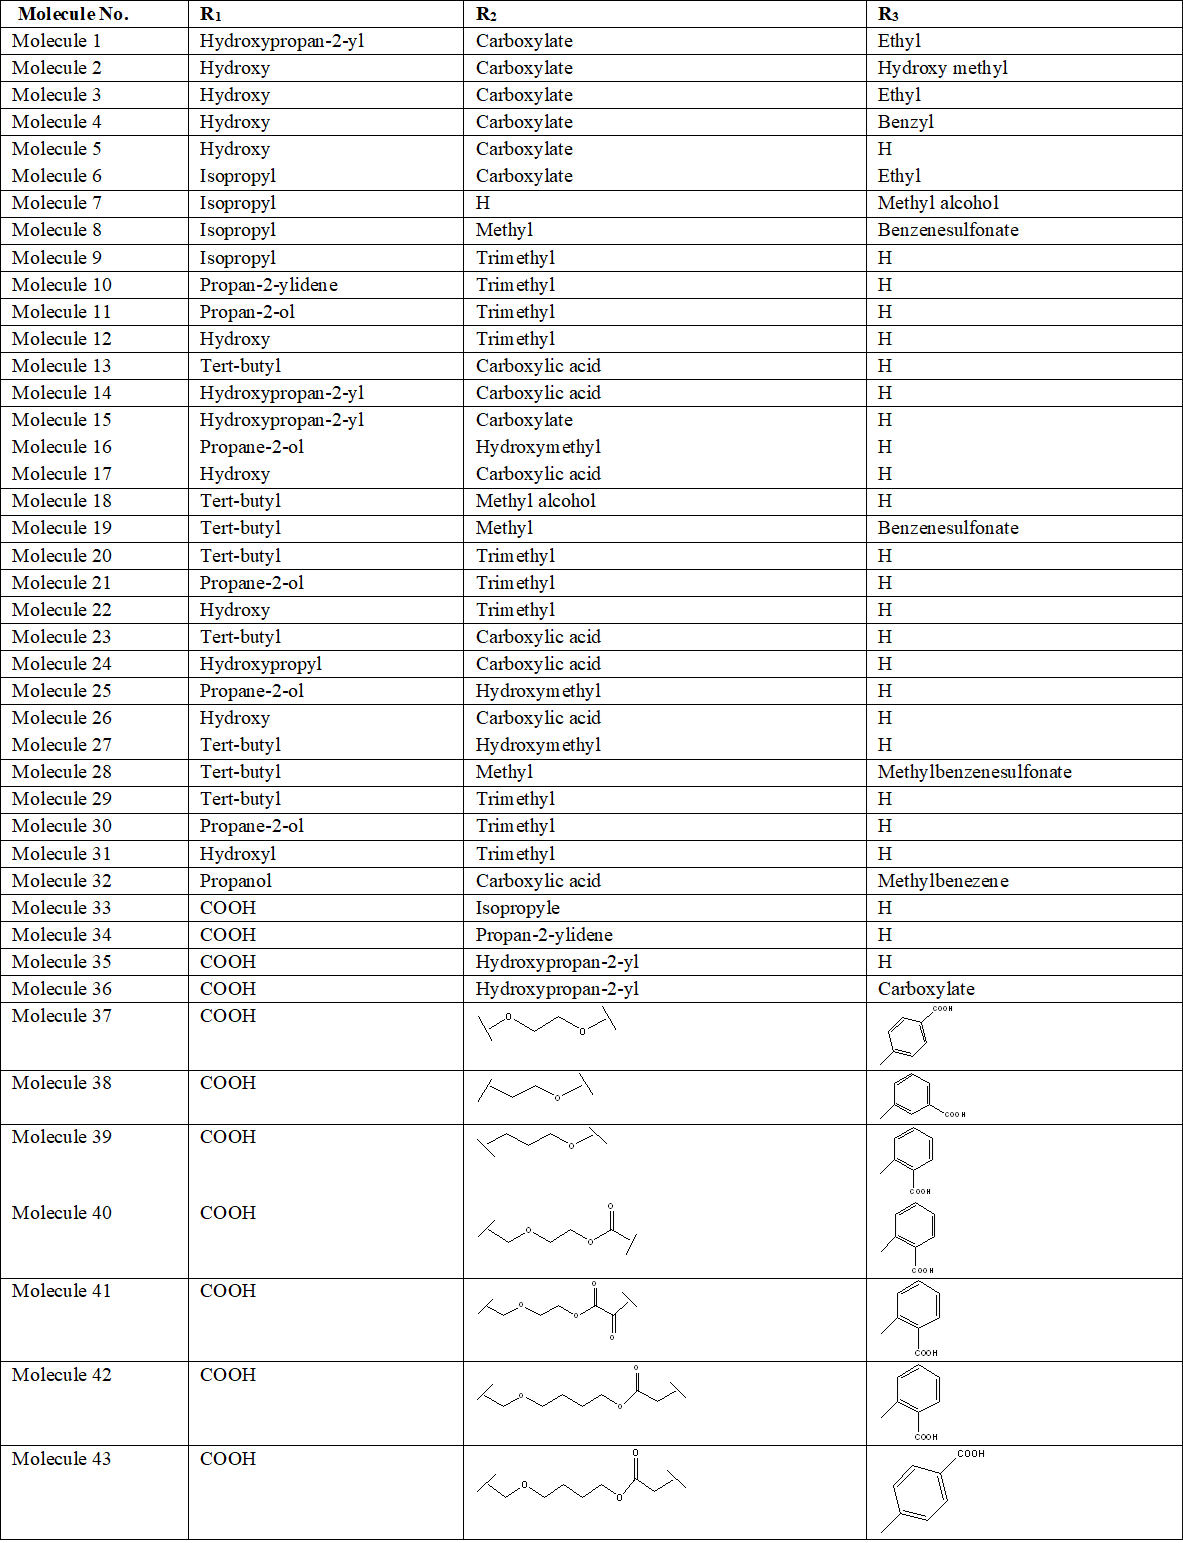
Note. R1, R2, and R3 = substitution positions on the tricyclic terpenoid scaffold. Structural modifications indicate the substituents introduced at the respective positions of molecules 01–60. Abbreviations: Me = methyl; Et = ethyl; Ph = phenyl; OMe = methoxy; OH = hydroxyl; COOH = carboxyl.
2.5 SwissADME prediction and Drug-Likeness Analysis
The SwissADME prediction (Absorption, Distribution, Metabolism, Excretion) and drug-likeness analysis of the selected molecules was performed using the SwissADME web-based server. Initially, the chemical structures of all selected molecules were prepared and represented in SMILES (Simplified Molecular Input Line Entry System) format. The individual SMILES strings were entered into the SwissADME platform, and the corresponding molecular structures were submitted for computational prediction [22][23]. The physicochemical properties of the molecules were evaluated, including molecular weight (MW), molecular formula, number of rotatable bonds, hydrogen-bond donors (HBD), hydrogen-bond acceptors (HBA), topological polar surface area (TPSA), and lipophilicity (consensus Log P) [24].
The aqueous solubility and overall drug-likeness of the molecules were further assessed using parameters such as ESOL predicted solubility, Lipinski’s Rule of Five, bioavailability score, and other drug-likeness criteria [24][25]. Pharmacokinetic properties related to absorption and distribution were evaluated by predicting gastrointestinal (GI) absorption, blood–brain barrier (BBB) permeability, P-glycoprotein (P-gp) substrate status, and skin permeability (Log Kp). The potential involvement of major cytochrome P450 enzymes in drug metabolism was also investigated by examining the predicted inhibitory activity against CYP1A2, CYP2C19, CYP2C9, CYP2D6, and CYP3A4 [23].
The resulting SwissADME predictions were collected and organized systematically, and the relevant parameters were compared among the selected molecules to identify molecules showing favorable physicochemical properties, predicted absorption, distribution characteristics, metabolic profiles, drug-likeness, and medicinal-chemistry profiles [23][24]. The final SwissADME output was exported and compiled into a tabulated format for further interpretation and comparative analysis.
¹H NMR measurements were obtained using a Bruker Avance 400 spectrometer, whereas ¹³C NMR spectra were acquired on a Bruker DPX 300 instrument. Tetramethylsilane (TMS) was employed as the reference standard for NMR measurements. Chemical shift values (δ) are reported in parts per million (ppm), and spin–spin coupling constants (J) are expressed in hertz (Hz). High-resolution mass spectrometric (HRMS) analyses were carried out using a micrOTOF-Q II 10203 spectrometer. Thin-layer chromatography (TLC) was conducted on precoated silica gel plates. The chromatographic spots were visualized under ultraviolet illumination at 254 and 365 nm and, where required, by treatment with suitable chromogenic reagents
2.6 Designing of Molecules
Based on the molecular docking results, five molecules exhibiting favorable binding interactions and docking scores against PTP1B were selected for further synthesis and experimental evaluation.
2.6.1 Synthesis of Carboxyphenoxyethoxy diterpene acid
Step-1: To a solution of carboxyphenyl (1 equivalent) and Potassium Carbonate (K₂CO₃) (5 equivalents) in N,N-Dimethylformamide (DMF) (2 mL/mmol), 3 equivalents of the tosylated alcohol, TsO(CH₂)ₙOH, dissolved in N,N-Dimethylformamide (2 mL/mmol) were added. The reaction mixture was stirred at 80°C for 5 hr., and then extracted with ethyl acetate (EtOAc). The combined organic layers were washed with brine, dried, and concentrated under reduced pressure. The resulting residue was purified by flash column chromatography to obtain the desired product.
Step-2: Take 1 equivalent of the alcohol and dissolve it in pyridine (3mL/mmol), then add 5 equivalents of tolylsulfonyl chloride (TsCl). Stir the mixture at room temperature for 8 hours, and then remove the pyridine by evaporation. Dissolve the remaining material in dichloromethane (DCM), wash and dry the mixture, and then concentrate the solution to remove the dichloromethane (DCM). Finally, purify the resulting product by flash column chromatography.
Step-3: Take 3 equivalents of the ester and dissolve it in N, N-Dimethylformamide (2 mL/mmol). Separately, dissolve 1 equivalent of molecule6b and 5 equivalents of potassium carbonate (K₂CO₃) in N, N-Dimethylformamide (2 mL/mmol), then add the ester solution to this mixture. Stir the reaction at 80°C for 5 hrs. After the reaction, extract the product with ethyl acetate (EtOAc), combine the organic layers, wash them with brine, and dry them. Remove the solvent under reduced pressure, and finally purify the residue by flash column chromatography to obtain the desired product.
Step-4: Take 1 equivalent of the benzyl ester and dissolve it in methanol (10 mL/mmol). Add 10% Pd/C (palladium on carbon) at 1 mg per mg of benzyl ester, and then carry out the hydrogenation at room temperature under 1 Megapascal (MPa) hydrogen pressure for 12 hrs. After completion, filter the mixture to remove the Pd/C catalyst and remove the methanol from the filtrate under reduced pressure. Finally, purify the remaining material by flash column chromatography [25][26].
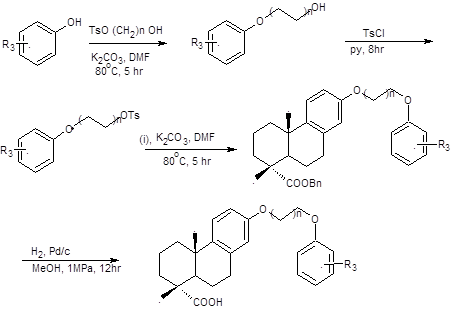
Note. R₃, variable substituent; OTs, tosylate group; COOBn, benzyl ester; R₃-substituted benzoyl ester, intermediate bearing the variable alkoxy chain; final product, deprotected carboxylic acid derivative.
2.6.2 Synthesis of Carboxybenzyl ether–phenanthrene acid
Step-1: To a solution of 1 equivalent of the carboxylic acid (R₃ = COOH) and (1.5 equivalents) of the diol, HO(CH₂)ₙOH, in acetonitrile (MeCN) was added (1.5 equivalents) of DCC and (0.05 equivalents) of 4-Dimethylaminopyridine (DMAP). The reaction mixture was stirred at 0°C for 1 hr. and then allowed to reach room temperature. After completion, the mixture was extracted with ethyl acetate (EtOAc), and the combined organic layers were washed with brine and dried. The solvent was removed under reduced pressure, and the resulting residue was purified by flash column chromatography to obtain the desired product.
Step-2: Take (1 equivalent) of the alcohol and dissolve it in pyridine (3 mL/mmol), then add (5 equivalents) of tolylsulfonyl chloride (TsCl). Stir the mixture at room temperature for 6 hrs. then remove the pyridine by evaporation. Dissolve the remaining material in dichloromethane (DCM) wash and dry the mixture, and concentrate the solution to remove the dichloromethane (DCM). Finally, purify the resulting product by flash column chromatography.
Step-3: Take 3 equivalents of the ester and dissolve it in N,N-dimethylformamide (DMF) (2 mL/mmol). Separately, dissolve (1 equivalent) of molecule (i) and (5 equivalents) of potassium carbonate in DMF (2 mL/mmol), then add the ester solution to this mixture. Stir the reaction at 80°C for 5 hrs. After completion, extract the product with ethyl acetate (EtOAc), combine the organic layers, wash them with brine, and dry them. Remove the solvent under reduced pressure, and finally purify the residue by flash column chromatography to obtain the desired product.
Step-4: Take (1 equivalent) of the benzyl ester and dissolve it in methanol (10 mL/mmol). Add 10% palladium on carbon (Pd/C) at (1 mg/mg) of benzyl ester, and carry out the hydrogenation at room temperature under 1MPa hydrogen pressure for 12 hrs. After completion, filter the mixture to remove the Pd/C catalyst, and then remove the methanol from the filtrate under reduced pressure. Finally, purify the remaining material by flash column chromatography to obtain the desired product [26][27].
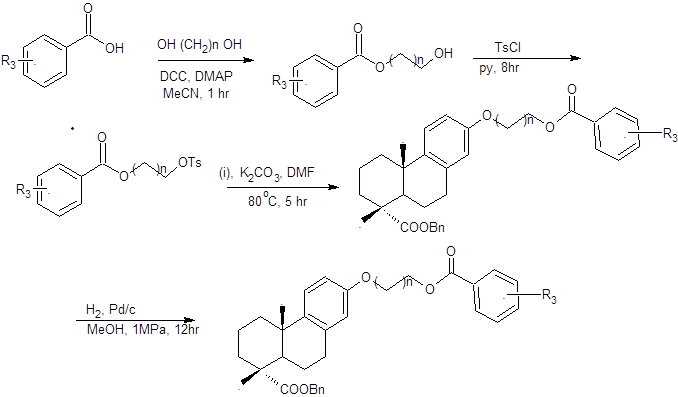
Note. DCC, N, N′-dicyclohexylcarbodiimide; DMAP, 4-dimethylaminopyridine; MeCN, acetonitrile; TsCl, p-toluenesulfonyl chloride; Py, pyridine; K₂CO₃, potassium carbonate; DMF, N, N-dimethylformamide; H₂, hydrogen; Pd/C, palladium on carbon; MeOH, methanol; OTs, tosylate; COOBn, benzyl ester; h, hours; °C, degrees Celsius.
2.7 PTP1B inhibition assay
The inhibitory assay was performed using human PTP1B (purchased from Sigma) and p-nitrophenylphosphate (pNPP) as sub strate by UV absorption. (400nmol) pNPP were dissolved in H2O and (48µL) of the solution was added to a (100µL) reaction now the concentration is 4 mM. The indicated amount of synthetic molecules was diluted in dimethyl sulfoxide (DMSO) at a concentration of (5mM). The PTP1B was diluted in pH 7.2 buffer contained (50mM) 4-(2-Hydroxyethyl)-1-piperazineethanesulfonic acid (HEPES), (3mM) dithiothreitol, (2mM) EDTA and (100mM) Sodium Chloride (NaCl). About (50µL) PTP1B dilution was added, and the mixture incubated at 37oC for 30min. 1N NaOH was added to terminate the reaction. UV–Vis absorption was detected at (410nm) using a Tecan Infinite M1000 plate reader [28].
3. Results
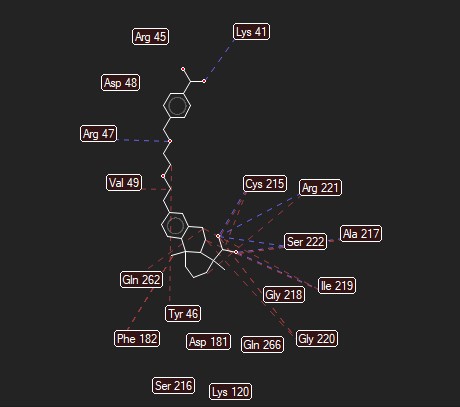
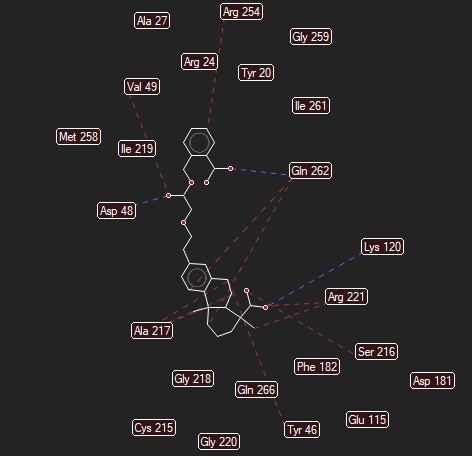
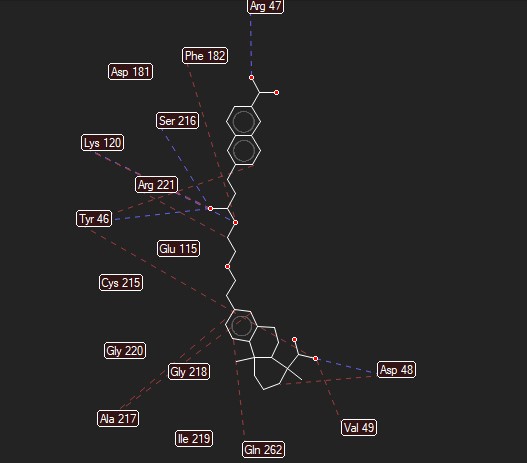
Molecular docking study shows the interaction between tricyclic terpenoid derivatives and active site of protein taken from Protein tyrosine phosphatase 1B (Pdb code- 2QBQ). MolDock Score and MolDock Rerank Score of most active molecule to that of reference ligand reveals the efficient docking interactions of the molecule. Cys 215, Gln 262, Val 49, Arg 47, Asp 48, Phe 182, Tyr 46, Glu 115, Asp 181, Ser 216, Lys 120, Arg 221, Gly 220, Ala 217, Ile 219 and Gly 218 are the major amino acid bindings responsible for biological activity. Among the reference ligand and molecule three of these amino acids bindings are in common which proves that the binding of the molecules takes place with the desired amino acids in the protein. Molecular docking scores and data also correlate and reconfirm the assumption regarding the design and development of new molecules. Molecular docking analysis was performed using the PTP1B crystal structure (PDB ID: 2QBQ) to compare the predicted binding affinities of reported molecules, and the corresponding docking scores are presented in Table 2.
| Molecule no. | MolDock Score | Rerank Score | H bond |
| 4B3 | -170.968 | -120.167 | -5.68016 |
| Molecule 1 | -115.795 | -82.8484 | -2.39675 |
| Molecule 2 | -111.916 | -71.1808 | -5.14237 |
| Molecule 3 | -116.555 | -39.999 | -5.50617 |
| Molecule 4 | -118.75 | -22.9744 | -8.28987 |
| Molecule 5 | -123.163 | -94.6534 | -2.60825 |
| Molecule 6 | -104.679 | -85.4268 | -6.99584 |
| Molecule 7 | -108.932 | -41.0403 | -6.4914 |
| Molecule 8 | -121.755 | -60.7137 | -2.13163 |
| Molecule 9 | -112.837 | -76.2841 | -5.16512 |
| Molecule 10 | -113.977 | -58.8726 | -9.39221 |
| Molecule 11 | -103.572 | -71.7267 | -3.76886 |
| Molecule 12 | -132.25 | -105.824 | -3.74116 |
| Molecule 13 | -100.069 | -68.8541 | 0 |
| Molecule 14 | -95.5169 | -65.443 | 0 |
| Molecule 15 | -103.449 | -67.3279 | 0 |
| Molecule 16 | -95.7146 | -69.835 | 0 |
| Molecule 17 | -103.59 | -69.3269 | -7.02479 |
| Molecule 18 | -154.973 | -103.07 | -6.46237 |
| Molecule 19 | -152.655 | -107.501 | -8.05037 |
| Molecule 20 | -120.34 | -27.8986 | -12.1018 |
| Molecule 21 | -116.893 | -26.4885 | -12.1776 |
| Molecule 22 | -115.664 | -95.4938 | -2.62628 |
| Molecule 23 | -107.311 | -88.0315 | -6.72023 |
| Molecule 24 | -111.888 | -75.2409 | -5.50413 |
| Molecule 25 | -107.359 | -78.5897 | -4.25416 |
| Molecule 26 | -130.385 | -104.201 | -3.67634 |
| Molecule 27 | -103.876 | -73.0789 | 0 |
| Molecule 28 | -104.715 | -75.206 | 0 |
| Molecule 29 | -93.5696 | -61.3532 | 0 |
| Molecule 30 | -118.065 | -59.4004 | -5.47824 |
| Molecule 31 | -118.516 | -79.9408 | -5.13159 |
| Molecule 32 | -114.185 | -23.7552 | -8.55645 |
| Molecule 33 | -105.948 | -86.8162 | -7.03065 |
| Molecule 34 | -112.835 | -75.4955 | -5.17435 |
| Molecule 35 | -106.862 | -76.1062 | -3.82944 |
| Molecule 36 | -102.038 | -69.3715 | 0 |
| Molecule 37 | -170.511 | -110.419 | -8.26797 |
| Molecule 38 | -95.7024 | -69.7968 | 5.18453 |
| Molecule 39 | -159.349 | -103.794 | -2.40146 |
| Molecule 40 | -164.662 | -90.6131 | -10.8329 |
| Molecule 41 | -162.48 | -103.902 | -6.17334 |
| Molecule 42 | -158.331 | -95.5284 | -3.93778 |
| Molecule 43 | -153.696 | -97.733 | -8.55287 |
| Molecule 44 | -172.873 | -101.06 | -3.92663 |
| Molecule 45 | -147.624 | -93.7122 | -6.21546 |
| Molecule 46 | -165.17 | -75.9346 | -5.77367 |
| Molecule 47 | -165.605 | -63.0446 | -6.26991 |
| Molecule 48 | -178.418 | -94.3535 | -5.83548 |
| Molecule 49 | -139.904 | -92.3739 | -6.01775 |
| Molecule 50 | -129.184 | -84.2332 | -4.81421 |
| Molecule 51 | -145.332 | -99.6573 | -5.43069 |
| Molecule 52 | -142.858 | -92.2863 | -7.82252 |
| Molecule 53 | -148.448 | -110.084 | -10.6547 |
| Molecule 54 | -142.263 | -85.0438 | -5.56501 |
| Molecule 55 | -156.798 | -109.175 | -11.7864 |
| Molecule 56 | -136.363 | -105.507 | -4.77723 |
| Molecule 57 | -145.578 | -111.039 | -4.64633 |
| Molecule 58 | -171.311 | -103.976 | -9.25353 |
| Molecule 59 | -113.495 | -73.2344 | -2.26221 |
| Molecule 60 | -163.029 | -93.1264 | -8.57216 |
Note. PTP1B, protein tyrosine phosphatase 1B; PDB, Protein Data Bank; MolDock, Molegro docking score; H bond, hydrogen-bond interaction. More negative docking scores indicate more favorable predicted binding. 4B_800[A] denotes the reference ligand.
The SwissADME prediction of the 60 molecules was performed using SwissADEM and analysis of predicted properties of molecule like molecular weight (MW), hydrogen-bond donors (HBD), hydrogen-bond acceptors (HBA), rotatable bonds, iLOGP, topological polar surface area (TPSA), gastrointestinal (GI) absorption, P-gp substrate status, and Lipinski rule violations. Overall, several molecules showed favorable predicted drug-like characteristics, with high GI absorption and zero Lipinski violations. Among the analyzed compounds, Molecules 37, 44, 47, 48, and 58 were selected as the most promising candidates based on their overall molecular-property profiles. Molecule 37 has a MW of 438.51, HBD of 2, HBA of 6, seven rotatable bonds, iLOGP of 3.30, and TPSA of 93.06 Ų, together with high GI absorption and zero Lipinski violations. Molecules 47 and 48 have a MW of approximately 480.59, HBD of 2, HBA of 6, ten rotatable bonds, TPSA of 93.06 Ų, high GI absorption, and zero Lipinski violations. Molecule 58 has a MW of 471.63, HBD of 2, HBA of 6, eleven rotatable bonds, iLOGP of 4.10, and TPSA of 84.86 Ų, with high GI absorption and zero Lipinski violations. Molecule 44 was also included among the selected candidates based on its reported molecular-property profile. Compared with the broader dataset, these selected molecules demonstrate combinations of favorable absorption and Lipinski compliance, although some possess relatively high molecular weight, TPSA, or rotatable-bond counts and several are predicted P-gp substrates. Therefore, Molecules 37, 44, 47, 48, and 58 can be considered the selected lead candidates for further molecular, biological, and pharmacological investigation, while the present SwissADME prediction alone cannot establish their biological efficacy, toxicity, or therapeutic suitability and the corresponding properties are presented in Table 3.
| Molecule Code | MW | H-bond donors | H-bond acceptors | Rotatable bonds | iLOGP | TPSA | GI absorption | Pgp substrate | Lipinski violations |
| Molecule 1 | 302.45 | 1 | 2 | 2 | 3.22 | 37.3 | High | No | 1 |
| Molecule 2 | 302.45 | 1 | 2 | 1 | 2.76 | 37.3 | High | No | 1 |
| Molecule 3 | 316.43 | 2 | 3 | 2 | 2.15 | 57.53 | High | Yes | 0 |
| Molecule 4 | 406.56 | 1 | 3 | 5 | 4.31 | 46.53 | High | Yes | 1 |
| Molecule 5 | 344.49 | 1 | 3 | 4 | 3.84 | 46.53 | High | No | 0 |
| Molecule 6 | 302.45 | 2 | 2 | 2 | 3.34 | 40.46 | High | No | 0 |
| Molecule 7 | 302.41 | 1 | 3 | 3 | 3.27 | 46.53 | High | No | 0 |
| Molecule 8 | 364.48 | 1 | 3 | 4 | 3.45 | 46.53 | High | Yes | 1 |
| Molecule 9 | 274.35 | 2 | 3 | 1 | 2.11 | 57.53 | High | Yes | 0 |
| Molecule 10 | 330.5 | 0 | 2 | 4 | 4.24 | 26.3 | High | No | 1 |
| Molecule 11 | 288.47 | 1 | 1 | 2 | 3.68 | 20.23 | High | No | 1 |
| Molecule 12 | 442.65 | 0 | 3 | 5 | 4.67 | 51.75 | Low | Yes | 1 |
| Molecule 13 | 272.47 | 0 | 0 | 1 | 3.95 | 0.0 | Low | No | 1 |
| Molecule 14 | 272.47 | 0 | 0 | 0 | 4.0 | 0.0 | Low | No | 1 |
| Molecule 15 | 286.45 | 1 | 1 | 1 | 3.47 | 20.23 | High | No | 1 |
| Molecule 16 | 244.37 | 1 | 1 | 0 | 2.82 | 20.23 | High | No | 1 |
| Molecule 17 | 284.48 | 0 | 0 | 1 | 3.97 | 0.0 | Low | Yes | 1 |
| Molecule 18 | 436.54 | 2 | 5 | 7 | 3.22 | 83.83 | High | Yes | 1 |
| Molecule 19 | 436.54 | 2 | 5 | 7 | 3.28 | 83.83 | High | Yes | 1 |
| Molecule 20 | 316.48 | 1 | 2 | 2 | 3.29 | 37.3 | High | No | 1 |
| Molecule 21 | 318.45 | 2 | 3 | 2 | 2.94 | 57.53 | High | Yes | 0 |
| Molecule 22 | 346.5 | 1 | 3 | 4 | 3.96 | 46.53 | High | No | 0 |
| Molecule 23 | 304.47 | 2 | 2 | 2 | 3.3 | 40.46 | High | No | 0 |
| Molecule 24 | 276.37 | 2 | 3 | 1 | 2.13 | 57.53 | High | Yes | 0 |
| Molecule 25 | 302.49 | 1 | 1 | 2 | 3.86 | 20.23 | High | No | 1 |
| Molecule 26 | 456.68 | 0 | 3 | 5 | 4.84 | 51.75 | Low | Yes | 1 |
| Molecule 27 | 286.49 | 0 | 0 | 1 | 4.07 | 0.0 | Low | No | 1 |
| Molecule 28 | 288.47 | 1 | 1 | 1 | 3.69 | 20.23 | High | No | 1 |
| Molecule 29 | 246.39 | 1 | 1 | 0 | 2.96 | 20.23 | High | No | 0 |
| Molecule 30 | 314.46 | 1 | 2 | 2 | 3.12 | 37.3 | High | No | 1 |
| Molecule 31 | 314.46 | 1 | 2 | 2 | 3.12 | 37.3 | High | No | 1 |
| Molecule 32 | 344.49 | 1 | 3 | 4 | 3.88 | 46.53 | High | No | 0 |
| Molecule 33 | 344.49 | 1 | 3 | 4 | 3.88 | 46.53 | High | No | 0 |
| Molecule 34 | 302.45 | 2 | 2 | 2 | 3.28 | 40.46 | High | No | 0 |
| Molecule 35 | 300.48 | 1 | 1 | 2 | 3.75 | 20.23 | High | No | 1 |
| Molecule 36 | 454.66 | 0 | 3 | 5 | 4.82 | 51.75 | Low | Yes | 1 |
| Molecule 37 | 438.51 | 2 | 6 | 7 | 3.3 | 93.06 | High | Yes | 0 |
| Molecule 38 | 286.45 | 1 | 1 | 1 | 3.6 | 20.23 | High | No | 1 |
| Molecule 39 | 286.45 | 1 | 1 | 1 | 3.6 | 20.23 | High | No | 1 |
| Molecule 40 | 522.63 | 2 | 7 | 12 | 3.83 | 110.13 | High | Yes | 1 |
| Molecule 41 | 536.61 | 2 | 8 | 12 | 3.21 | 127.2 | Low | Yes | 1 |
| Molecule 42 | 550.68 | 2 | 7 | 14 | 4.06 | 110.13 | Low | Yes | 2 |
| Molecule 43 | 550.68 | 2 | 7 | 14 | 4.1 | 110.13 | Low | Yes | 2 |
| Molecule 44 | 550.68 | 2 | 7 | 14 | 4.17 | 110.13 | Low | Yes | 2 |
| Molecule 45 | 550.68 | 2 | 7 | 14 | 4.17 | 110.13 | Low | Yes | 2 |
| Molecule 46 | 508.65 | 2 | 6 | 12 | 4.02 | 93.06 | High | Yes | 1 |
| Molecule 47 | 480.59 | 2 | 6 | 10 | 3.89 | 93.06 | High | Yes | 0 |
| Molecule 48 | 480.59 | 2 | 6 | 10 | 3.7 | 93.06 | High | Yes | 0 |
| Molecule 49 | 494.58 | 2 | 7 | 10 | 3.26 | 110.13 | High | Yes | 0 |
| Molecule 50 | 478.62 | 1 | 5 | 11 | 4.59 | 72.83 | High | Yes | 1 |
| Molecule 51 | 494.62 | 2 | 6 | 11 | 3.96 | 93.06 | High | Yes | 0 |
| Molecule 52 | 513.06 | 1 | 5 | 11 | 4.6 | 72.83 | High | Yes | 2 |
| Molecule 53 | 493.63 | 2 | 5 | 11 | 3.98 | 98.85 | High | Yes | 0 |
| Molecule 54 | 479.61 | 1 | 6 | 11 | 3.94 | 85.72 | High | Yes | 0 |
| Molecule 55 | 536.66 | 2 | 7 | 13 | 3.78 | 110.13 | High | Yes | 1 |
| Molecule 56 | 528.68 | 2 | 7 | 12 | 4.05 | 110.13 | Low | Yes | 1 |
| Molecule 57 | 485.66 | 2 | 6 | 11 | 4.47 | 84.86 | High | Yes | 0 |
| Molecule 58 | 471.63 | 2 | 6 | 11 | 4.1 | 84.86 | High | Yes | 0 |
| Molecule 59 | 600.74 | 2 | 7 | 14 | 4.28 | 110.13 | Low | Yes | 2 |
| Molecule 60 | 458.72 | 2 | 3 | 1 | 3.96 | 57.53 | Low | No | 1 |
Note. MW = Molecular Weight; HBD = Hydrogen-Bond Donors; HBA = Hydrogen-Bond Acceptors; iLOGP = Intrinsic Lipophilicity; TPSA = Topological Polar Surface Area; GI = Gastrointestinal; P-gp = P-glycoprotein. Molecules 37, 44, 47, 48, and 58 were selected as promising candidates based on their overall predicted molecular profiles.
| Molecule | Physical appearance/Color | Melting point (°C) | Percentage yield (%) | Rf value | Solvent system |
| 37 | White to off-white solid | 168–170 | 72 | 0.62 | Toluene:Ethyl acetate (8:2) |
| 44 | Pale yellow solid | 182–184 | 68 | 0.58 | Toluene:Ethyl acetate (7:3) |
| 47 | White crystalline solid | 174–176 | 75 | 0.64 | Toluene:Ethyl acetate (8:2) |
| 48 | Off-white crystalline solid | 186–188 | 78 | 0.61 | Toluene:Ethyl acetate (7:3) |
| 58 | White crystalline solid | 191–193 | 81 | 0.56 | Toluene:Ethyl acetate (7:3) |
| Molecule | IR Data in (cm⁻¹) |
| Molecule 37 | Broad, strong 3580 cm⁻¹ (carboxylic acid O–H stretching); 2890 cm⁻¹ (aliphatic C–H stretching); ~3057 cm⁻¹ (aromatic C–H stretching); 1708 cm⁻¹ (carboxylic acid C=O stretching); 1590 and 1558 cm⁻¹ (aromatic C=C stretching); 1450 and 1380 cm⁻¹ (CH₂ and CH₃ bending); 1190 cm⁻¹ (C–O and aryl ether Ar–O–CH₂ stretching); 875 cm⁻¹ (aromatic C–H out-of-plane bending). |
| Molecule 44 | Very broad, strong 3458 cm⁻¹ (O–H stretching of two carboxylic acid groups); 2897 cm⁻¹ (aliphatic C–H stretching); 3055 cm⁻¹ (aromatic C–H stretching); 1697 cm⁻¹ (C=O stretching of two –COOH groups); 1590 and 1513 cm⁻¹ (aromatic C=C stretching); 1447 and 1373cm⁻¹ (CH₂ and CH₃ bending); 1190 cm⁻¹ (C–O stretching of benzyl ether and ethoxy groups); 865 cm⁻¹ (aromatic C–H out-of-plane bending). |
| Molecule 47 | Broad, strong 3490 cm⁻¹ (O–H stretching of two carboxylic acid groups); 2914 cm⁻¹ (aliphatic C–H stretching); 3033 cm⁻¹ (aromatic C–H stretching); 1703 cm⁻¹ (C=O stretching of carboxylic acid groups); 1580 and 1478 cm⁻¹ (aromatic C=C stretching); 1428 and 1371 cm⁻¹ (CH₂ and CH₃ bending); 1208 cm⁻¹ (C–O–C and C–O stretching of benzyl ether and ethoxy groups); 832 cm⁻¹ (aromatic C–H out-of-plane bending). |
| Molecule 48 | Very broad, strong 3560 cm⁻¹ (O–H stretching of two carboxylic acid groups); 2891 cm⁻¹ (aliphatic C–H stretching); 3041 cm⁻¹ (aromatic C–H stretching); 1720 cm⁻¹ (carboxylic acid C=O and ester carbonyl C=O stretching); 1552 and 1489 cm⁻¹ (aromatic C=C stretching); 1426 and 1372 cm⁻¹ (CH₂ and CH₃ bending); 1238 cm⁻¹ (C–O and C–O–C stretching of benzyl ether, ethoxy and ester groups); 857 cm⁻¹ (aromatic C–H out-of-plane bending). |
| Molecule 58 | Broad, strong 3549 cm⁻¹ (O–H stretching of carboxylic acid groups); 2876 cm⁻¹ (aliphatic C–H stretching); 3060 cm⁻¹ (aromatic C–H stretching); 1713 cm⁻¹ (carboxylic acid and ester C=O stretching); 1601, 1580 and 1502 cm⁻¹ (aromatic C=C stretching of naphthalene/phenanthrene); 1435 cm⁻¹ (CH₂ and CH₃ bending); 1254 cm⁻¹ (C–O and ester C–O–C stretching); 867 cm⁻¹ (aromatic C–H out-of-plane bending). |
1H and 13C NMR Spectroscopic Data of the Synthesized Molecules
Molecule37
¹H NMR (400 MHz, CDCl₃): δ 7.70 (d, J = 7.6 Hz, 1H), 7.64 (s, 1H), 7.38 (t, J = 7.9 Hz, 1H), 7.21–7.12 (m, 2H), 6.78–6.72 (m, 1H), 6.61 (s, 1H), 5.29 (s, 1H), 4.32 (dd, J = 13.0, 3.4 Hz, 3H), 3.01–2.79 (m, 2H), 2.25 (dd, J = 23.2, 12.4 Hz, 2H), 1.83 (dd, J = 21.6, 11.8 Hz, 2H), 1.73 (t, J = 11.0 Hz, 2H), 1.53 (dd, J = 12.7, 6.6 Hz, 1H), 1.48–1.32 (s, 3H), 1.28–1.21 (s, 3H).
¹³C NMR (300 MHz, CDCl₃): δ 182.2, 169.8, 156.7, 154.1, 140.5, 134.5, 128.6, 127.6, 123.4, 121.0, 119.2, 113.2, 112.3, 110.7, 64.8, 64.3, 45.4, 42.7, 36.1, 34.7, 28.2, 23.2, 19.7, 16.5, 14.2.
Molecule44
¹H NMR (400 MHz, CDCl₃): δ 8.13 (dd, J = 7.8, 1.7 Hz, 1H), 7.56–7.46 (m, 1H), 7.18–7.01 (m, 3H), 6.75 (dd, J = 8.7, 2.6 Hz, 1H), 6.59 (d, J = 2.5 Hz, 1H), 5.30 (s, 1H), 4.42 (t, J = 6.0 Hz, 2H), 4.15 (t, J = 5.4 Hz, 2H), 2.95–2.82 (m, 3H), 2.41–2.32 (m, 2H), 2.28 (d, J = 12.6 Hz, 1H), 2.21 (d, J = 12.3 Hz, 1H), 1.90–1.78 (m, 4H), 1.78–1.67 (m, 3H), 1.52–1.26 (m, 3H), 1.23 (s, 3H), 1.23 (s, 3H).
¹³C NMR (300 MHz, CDCl₃): δ 184.7, 166.1, 157.5, 156.0, 142.2, 136.2, 135.0, 133.6, 125.3, 122.0, 117.6, 113.6, 112.5, 112.2, 67.3, 64.3, 47.2, 44.5, 38.0, 36.5, 36.4, 30.0, 29.0, 25.0, 21.4, 18.3, 16.0.
Molecule47
¹H NMR (400 MHz, CDCl₃): δ 8.19 (dd, J = 7.8, 1.4 Hz, 1H), 7.61–7.49 (m, 1H), 7.19–7.01 (m, 3H), 6.76 (dd, J = 8.6, 2.5 Hz, 1H), 6.61 (d, J = 2.3 Hz, 1H), 4.61–4.49 (m, 2H), 4.40–4.28 (m, 2H), 3.00–2.76 (m, 3H), 2.25 (dd, J = 31.5, 12.4 Hz, 3H), 1.93–1.79 (m, 4H), 1.79–1.68 (s, 3H), 1.26 (d, J = 13.2 Hz, 4H), 1.22–1.14 (m, 4H).
³C NMR (300 MHz, CDCl₃): δ 184.6, 166.0, 157.1, 155.3, 143.0, 136.4, 134.9, 133.7, 125.4, 122.5, 118.3, 114.0, 113.2, 112.5, 68.3, 65.1, 47.2, 44.5, 38.0, 36.5, 30.0, 25.0, 21.4, 18.3, 16.0.
Molecule48
1H NMR (400 MHz, CDCl₃): δ 7.89 (d, J = 7.0 Hz, 1H), 7.65 (d, J = 7.1 Hz, 1H), 7.61–7.42 (m, 2H), 7.10 (t, J = 8.8 Hz, 1H), 6.71 (dd, J = 8.5, 1.9 Hz, 1H), 6.56 (s, 1H), 4.62 (s, 2H), 4.21 (s, 1H), 4.13 (q, J = 7.1 Hz, 1H), 2.82 (d, J = 5.4 Hz, 2H), 2.33–2.09 (m, 2H), 2.06 (s, 1H), 1.90–1.63 (m, 6H), 1.27 (t, J = 7.1 Hz, 5H), 1.17 (d, J = 7.4 Hz, 3H).
¹³C NMR (300 MHz, CDCl₃): δ 185.2, 179.6, 173.5, 171.1, 156.0, 142.2, 136.1, 130.7, 129.7, 128.6, 125.3, 125.2, 114.8, 113.9, 112.9, 112.7, 65.3, 60.3, 47.2, 44.5, 38.0, 36.4, 30.0, 25.0, 21.5, 18.3, 16.0, 14.0.
Molecule58
¹H NMR (400 MHz, CDCl₃): δ 8.02 (d, J = 8.7 Hz, 1H), 7.50 (t, J = 7.5 Hz, 1H), 7.36 (t, J = 7.3 Hz, 1H), 7.28 (d, J = 8.4 Hz, 1H), 7.14 (d, J = 8.8 Hz, 1H), 6.73 (dd, J = 8.7, 2.6 Hz, 1H), 6.59 (d, J = 2.5 Hz, 1H), 4.66–4.59 (m, 2H), 4.31–4.20 (m, 2H), 4.04 (s, 2H), 2.92–2.68 (m, 2H), 2.27 (d, J = 12.5 Hz, 1H), 2.18 (d, J = 13.9 Hz, 1H), 1.92–1.82 (m, 2H), 1.82–1.66 (m, 3H), 1.58–1.39 (m, 2H), 1.26 (s, 3H), 1.18 (s, 3H)
1³C NMR (300 MHz, CDCl₃): δ 185.0, 176.8, 167.1, 156.0, 142.3, 136.2, 135.2, 132.6, 132.2, 131.1, 129.2, 127.5, 125.2, 114.0, 112.6, 65.5, 63.6, 47.2, 44.5, 40.5, 37.9, 36.5, 36.4, 30.0, 25.0, 21.4, 18.3, 16.0.
| S. No. | Molecule | IC50 (µM) ± SD |
| 1 | 37 | 8.03 ± 3.60 |
| 2 | 44 | 10.45 ± 0.25 |
| 3 | 47 | 8.10 ± 0.21 |
| 4 | 48 | 8.20 ± 2.23 |
| 5 | 58 | 6.26 ± 2.07 |
| 6 | Standard | 2.40 ± 0.23 |
Note: Values are expressed as IC50 (µM) ± SD
Among the tested molecule, molecule 58 showed the highest PTP1B inhibitory potency (lowest IC₅₀ = 6.26 ± 2.07µM), followed by compounds 37, 47, 48, and 58. The standard exhibited substantially greater inhibitory potency with an IC₅₀ of 2.40 ± 0.23 µM.
4. Discussion
The present study employed an integrated computational and experimental approach to identify and evaluate substituted tricyclic terpenoid derivatives as potential protein tyrosine phosphatase 1B (PTP1B) inhibitors. Previous studies have demonstrated the potential of terpenoid scaffolds as PTP1B inhibitors. Li et al. (2019) reported tricyclic podocarpatriene derivatives with micromolar PTP1B inhibitory activity [29] while Zhang et al. (2023) identified potent isosteviol-derived PTP1B inhibitors with submicromolar activity [30]. In comparison, the present study is significant because it combines molecular docking, SwissADME prediction, and experimental validation to systematically identify substituted tricyclic terpenoid derivatives as potential PTP1B inhibitors. The prioritization of molecules 37, 44, 47, 48, and 58 therefore provides new structural leads and establishes a rational framework for further optimization of this scaffold.
The molecular docking results showed that the designed tricyclic terpenoid derivatives could effectively occupy the PTP1B active-site region and interact with key residues involved in ligand recognition. Notably, interactions with Cys215, Gln262, Val49, Arg47, Asp48, Phe182, Tyr46, Glu115, Asp181, Ser216, Lys120, Arg221, Gly220, Ala217, Ile219, and Gly218 support the favorable binding orientation of the designed molecules. These findings are consistent with previous PTP1B inhibitor studies emphasizing the importance of catalytic-site residues, particularly Cys215 and surrounding recognition residues, for inhibitor binding (Bialy et al., 2005) [31]. Thus, the observed interactions provide a structural rationale for the designed tricyclic terpenoid scaffold and support the selection of these molecules for further experimental evaluation and optimization.
Among the selected molecule, molecule 48 showed the most favorable MolDock score (−178.418), followed by molecules 44 (−172.873), 58 (−171.311), 37 (−170.511), and 47 (−165.605), indicating differences in their predicted binding affinities toward PTP1B. Notably, molecule 58 exhibited the strongest hydrogen-bond score (−9.25353), suggesting favorable hydrogen-bonding interactions within the binding pocket. Similar structure-dependent variations in docking affinity have been reported for terpenoid-based PTP1B inhibitors, where substitution patterns influenced ligand–protein interactions and inhibitory potential (Li et al., 2019; Zhang et al., 2023) [29,30]. Thus, the present docking results suggest that modification of the substitution pattern on the tricyclic terpenoid scaffold can substantially influence PTP1B binding, providing useful guidance for subsequent structure–activity relationship optimization.
Compared with previous studies, the present work demonstrates the importance of evaluating both PTP1B binding and drug-like properties when prioritizing tricyclic terpenoid derivatives. Yang et al. (2020) reported tricyclic terpenoid PTP1B inhibitors with improved pharmacological properties and identified molecules with promising enzymatic and in vivo antihyperglycaemic activity [32]. Similarly, Li et al. (2023) reported isosteviol derivatives with potent PTP1B inhibition, with molecule 24 showing an IC₅₀ of 0.24 μM and favorable selectivity [30]. In the present study, molecule 37 is particularly significant because it combines favorable predicted PTP1B binding with a comparatively balanced SwissADME prediction profile, including high gastrointestinal absorption, absence of Lipinski and PAINS violations, and no predicted BBB permeability. In contrast, molecule 44, despite its strong docking performance, showed high lipophilicity, poor solubility, low gastrointestinal absorption, and Lipinski violations. Thus, the present study extends previous terpenoid-based PTP1B research by demonstrating that docking affinity alone is insufficient for lead selection and that simultaneous consideration of SwissADME prediction and physicochemical properties can identify more developmentally promising candidates. This integrated prioritization represents an important contribution toward the rational optimization of tricyclic terpenoid PTP1B inhibitors. Compared with earlier terpenoid-based PTP1B inhibitor studies, molecule 58 demonstrated a particularly favorable balance between predicted target interaction and drug-like properties. Previous studies have shown that terpenoid derivatives can provide potent PTP1B inhibition, but increasing structural complexity or lipophilicity may adversely affect solubility and pharmacokinetic behavior. For example, Yang et al. (2019) reported tricyclic terpenoid derivatives as promising PTP1B inhibitors[31], while Li et al. (2023) demonstrated potent PTP1B inhibition from isosteviol-derived molecules [30]. In the present study, molecule 58 is noteworthy because it combines a favorable molecular weight (471.63 g/mol), moderate iLogP (4.1), TPSA of 84.86 Ų, high predicted gastrointestinal absorption, and absence of Lipinski violations. Moreover, its strong hydrogen-bond score (−9.25353) supports favorable ligand–target interactions. The overall balance of docking performance and ADMET characteristics identifies molecule 58 as a promising lead for further PTP1B inhibitor development. Thus, the present study contributes by demonstrating that optimization of the tricyclic terpenoid scaffold can achieve a balance between predicted binding and drug-like properties, rather than relying solely on docking affinity.
The spectroscopic characterization further supported the structures of the selected molecules. The The FTIR findings provide spectroscopic confirmation of the major functional groups incorporated into the synthesized tricyclic terpenoid derivatives. Molecules 47, 48, and 58 displayed characteristic O–H stretching bands at 3490, 3560, and 3549 cm⁻¹, respectively, together with carbonyl absorptions at 1703, 1720, and 1713 cm⁻¹ and aromatic C=C stretching vibrations in the expected region. The C–O/C–O–C stretching bands observed between 1208 and 1254 cm⁻¹ further supported the presence of hydroxyl and ester/ether functionalities. These observations are consistent with reported FTIR characteristics of oxygenated terpenoid derivatives, in which O–H, C=O, aromatic C=C, and C–O vibrations serve as important structural indicators. The significance of the present FTIR analysis is that it experimentally supports the successful incorporation of the functional groups predicted from the molecular structures, thereby providing preliminary spectroscopic validation of the synthesized molecules before their biological evaluation. Moreover, the close agreement of the observed absorption regions among molecules 47, 48, and 58 confirms the preservation of the common tricyclic terpenoid framework while reflecting differences in their substitution patterns.
The ¹H and ¹³C NMR spectral data provided further evidence for the successful structural characterization of the synthesized tricyclic terpenoid derivatives. Molecule 37 exhibited characteristic aromatic proton signals in the δ 7.70–6.61 ppm region, while its ¹³C NMR spectrum showed downfield resonances at δ 182.2 and 169.8 ppm, consistent with carbonyl-containing functionalities. Similarly, molecule 44 displayed aromatic proton resonances at δ 8.13–6.59 ppm and characteristic carbon signals at δ 184.7 and 166.1 ppm. Molecules 47, 48, and 58 also exhibited the expected aromatic, oxygenated, and aliphatic proton and carbon resonances, consistent with their proposed structures. The significance of these findings is that the NMR data provide complementary structural confirmation to the FTIR results, demonstrating the presence and chemical environment of the key functional groups incorporated into the designed molecules. Collectively, the agreement between the spectroscopic data and proposed structures strengthens the structural validity of the synthesized derivatives and provides a reliable foundation for interpreting their subsequent molecular docking, SwissADME prediction, and biological evaluation.
The PTP1B inhibitory results demonstrate that the synthesized tricyclic terpenoid derivatives possess measurable enzymatic activity, with molecule 58 showing the highest potency (IC₅₀ = 6.26 ± 2.07µM), followed by molecule 37 (8.03 ± 3.60 µM). These findings are consistent with earlier work by Yang et al. (2019), who demonstrated that structural simplification and modification of a pentacyclic terpenoid scaffold could generate tricyclic derivatives with PTP1B inhibitory activity[32] and improved pharmacological properties. More recently, Li et al. (2023) reported isosteviol-derived PTP1B inhibitors, with the most active derivative exhibiting an IC₅₀ of 0.24 µM and demonstrating selective PTP1B inhibition[30] confirming the potential of diterpenoid frameworks as PTP1B inhibitor scaffolds. The significance of the present study lies in extending this terpenoid-based PTP1B inhibitor concept to the newly investigated substituted tricyclic derivatives and, importantly, experimentally validating molecules that were prioritized through docking and SwissADME prediction. Although the present molecules are less potent than highly optimized literature leads, molecule 58 represents a valuable starting point because it produced the strongest experimental inhibition among the synthesized candidates. Furthermore, the difference between the docking ranking (molecule 48 being the best-scoring molecule) and experimental potency (molecule 58 being the most active) is particularly informative, demonstrating that computational binding scores alone cannot reliably predict enzymatic inhibition. Therefore, the integrated computational experimental approach used in this study provides useful SAR information and identifies molecules 37 and 58 as priority leads for further structural optimization, selectivity studies, and mechanistic investigation. Interestingly, the experimental PTP1B inhibitory activity did not directly correspond to the docking ranking. Although molecule 48 showed the most favorable MolDock score, molecule 58 demonstrated the highest experimental inhibitory activity among the selected molecules. This observation indicates that docking scores alone cannot fully predict experimental enzyme inhibition and emphasizes the importance of experimental validation of computational findings. The differences may reflect the influence of physicochemical properties and other factors that are not completely represented by docking calculations.
Conclusion
The present study demonstrated the potential of substituted tricyclic terpenoid derivatives as possible protein tyrosine phosphatase 1B (PTP1B) inhibitors with relevance to antihyperglycemic drug discovery. Molecular docking analysis indicated that several designed molecules could interact favorably with the PTP1B active-site region, with molecule 48 showing the most favorable MolDock score (−178.418). Molecule 58 exhibited the strongest predicted hydrogen-bonding interaction and a comparatively balanced SwissADME prediction, whereas molecule 58 demonstrated the highest experimentally determined PTP1B inhibitory activity among the selected molecules, with an IC₅₀ value of 6.26 ± 2.07µM. The FTIR and ¹H and ¹³C NMR spectral data supported the proposed structures of the synthesized molecules through the presence of characteristic functional-group and aromatic, oxygenated, and aliphatic resonances. In particular, molecule 58 showed favorable predicted gastrointestinal absorption, moderate lipophilicity, no Lipinski violations. The experimental inhibitory activity did not completely correspond to the molecular docking ranking, demonstrating that computational docking should be considered a predictive screening approach rather than a direct measure of biological potency.
List of abbreviations
ADME: Absorption, Distribution, Metabolism, and Excretion
ADMET: Absorption, Distribution, Metabolism, Excretion, and Toxicity
AR: Analytical Reagent
BBB: Blood–Brain Barrier
CADD: Computer-Aided Drug Design
COOH: Carboxyl Group
CYP: Cytochrome P450
CYP1A2: Cytochrome P450 1A2
CYP2C19: Cytochrome P450 2C19
CYP2C9: Cytochrome P450 2C9
CYP2D6: Cytochrome P450 2D6
CYP3A4: Cytochrome P450 3A4
DCC: N,N′-Dicyclohexylcarbodiimide
DCM: Dichloromethane
DMAP: 4-Dimethylaminopyridine
DMF: N,N-Dimethylformamide
DMSO: Dimethyl Sulfoxide
DPP-4: Dipeptidyl Peptidase-4
Et: Ethyl
EtOAc: Ethyl Acetate
GI: Gastrointestinal
GLP-1: Glucagon-Like Peptide-1
H₂: Hydrogen
HBA: Hydrogen-Bond Acceptors
HBD: Hydrogen-Bond Donors
HEPES: 4-(2-Hydroxyethyl)-1-piperazineethanesulfonic Acid
HRMS: High-Resolution Mass Spectrometry
Hz: Hertz
IC₅₀: Half-Maximal Inhibitory Concentration
iLOGP: Intrinsic Lipophilicity Index
IR: Insulin Receptor
IRS: Insulin Receptor Substrate
K₂CO₃: Potassium Carbonate
Log Kp: Skin Permeability Coefficient
Log P: Partition Coefficient
Me: Methyl
MeCN: Acetonitrile
MeOH: Methanol
MM2: Molecular Mechanics 2
MPa: Megapascal
MW: Molecular Weight
MOPAC: Molecular Orbital Package
NaCl: Sodium Chloride
NMR: Nuclear Magnetic Resonance
Ome: Methoxy
OH: Hydroxyl Group
Ots: Tosylate Group
PDB: Protein Data Bank
Pd/C: Palladium on Carbon
P-gp: P-Glycoprotein
Ph: Phenyl
pNPP: p-Nitrophenyl Phosphate
ppm: Parts Per Million
PTP1B: Protein Tyrosine Phosphatase 1B
R₁, R₂, and R₃: Variable Substitution Positions
RCSB: Research Collaboratory for Structural Bioinformatics
RMS: Root Mean Square
SA: Synthetic Accessibility
SD: Standard Deviation
SGLT2: Sodium-Glucose Cotransporter 2
SMILES: Simplified Molecular Input Line Entry System
T2DM: Type 2 Diabetes Mellitus
TLC: Thin-Layer Chromatography
TMS: Tetramethylsilane
TPSA: Topological Polar Surface Area
TsCl: p-Toluenesulfonyl Chloride
UV: Ultraviolet
UV–Vis: Ultraviolet–Visible
VALSTAT: VALSTAT Regression Analysis Program
Declarations
Ethics approval and consent to participate
Not applicable
Data Availability
The protein crystal structure used in this study is publicly available in the RCSB Protein Data Bank (PDB) under accession ID 2QBQ: https://www.rcsb.org/structure/2QBQ.
Conflicts of Interest
The author(s) declare(s) that there is no conflict of interest regarding the publication of this paper.
Funding Statement
Not Applicable
Authors' contributions
Deshbandhu Joshi contributed to the conceptualization, methodology, investigation, data curation, formal analysis, molecular docking studies, synthesis, and preparation of the original manuscript. Praveen Kumar Soni contributed to supervision, validation, critical review, and editing of the manuscript. Both authors reviewed and approved the final version of the manuscript
Acknowledgments
The authors sincerely acknowledge the School of Pharmacy, Sangam University, Bhilwara, Rajasthan, India, for providing the necessary facilities and support to carry out this research work.