Introduction
Screen-based devices, particularly smartphones, have become an almost constant presence in the daily lives of young adults and their use in the period immediately before sleep has attracted growing public health attention [1]. Evening and pre-bedtime screen exposure has been linked to delayed sleep onset, shortened sleep duration and poorer subjective sleep quality in youth populations, plausibly through a combination of blue-light-mediated melatonin suppression, cognitive and emotional arousal from screen content and displacement of sleep time itself [1,2]. Beyond its effects on sleep, problematic or excessive screen use has also been associated with poorer daytime functioning and adverse psychological outcomes, including depressive symptoms, in student populations across several countries [3,4].
University and college students represent a population of particular interest, given the combination of academic pressure, socially reinforced late-night device use and a developmental stage in which sleep needs remain high but are frequently unmet [2,4]. Indian studies examining smartphone or screen use in student populations have generally been confined to single institutions or specific professional courses such as medicine or dentistry [3], limiting the extent to which findings generalise across the broader population of young adult students in the country.
In particular, students living in geographically isolated and infrastructurally under-served regions remain essentially unstudied with respect to screen-related sleep and mental-health outcomes, despite plausible differences from mainland urban settings in internet infrastructure, availability of recreational alternatives and academic environment. The Andaman and Nicobar Islands, an island union territory in the Bay of Bengal, exemplify this gap: to our knowledge, no prior study has examined screen-time patterns and their association with sleep or mental health among students in this setting.
The aim of this study was therefore to examine the associations of two dimensions of screen exposure, total daily screen time and screen use in the hour before bed, with validated measures of sleep quality, daytime sleepiness and depressive symptoms among young adult students drawn from a multi-site Indian dataset in which the Andaman and Nicobar Islands served as the lead site. Specifically, we sought to determine which pattern of screen use carries the stronger and more consistent association with poor sleep and psychological wellbeing, so as to inform more precisely targeted screen-use guidance for young adults, including those in geographically isolated settings.
Methods
Study design and setting
This cross-sectional analysis used data from a multicentric online observational survey on sleep health conducted across four Indian sites (the Andaman and Nicobar Islands, Delhi, Jammu and Kashmir and Rajasthan), together with a pooled group of other Indian states and union territories, each of which contributed fewer than ten respondents. The Andaman and Nicobar Islands, an isolated archipelago in the Bay of Bengal with limited academic-institution density relative to mainland sites, served as the designated lead site. Data were collected entirely online through Google Forms (Google LLC, Mountain View, CA, USA) over approximately three months, between June and August 2026, without any physical contact or in-person interaction with participants. The study is reported in accordance with the Strengthening the Reporting of Observational Studies in Epidemiology (STROBE) statement for cross-sectional studies [5].
Study population and eligibility criteria
Eligible participants for the parent survey were adults aged 18 years and above who had resided in the respective study area for a minimum of six months, could comprehend and respond to the questionnaire in English and provided informed electronic consent. Incomplete or grossly implausible responses were excluded during data cleaning. The present analysis was restricted to respondents who were young adults (18-24 years) and who self-identified as students by occupation, yielding an analytic subgroup of 581 participants. This subgroup was selected because screen-use patterns and their consequences for sleep and mental health are of particular relevance to this academically engaged and behaviourally homogeneous group.
Sample size
This analysis is a sub-analysis of an existing multi-site dataset assembled for a broader parent survey on sleep health. A separate a priori sample-size calculation was not performed for this screen-time sub-analysis; the realised analytic subgroup (n=581) reflects the number of eligible student respondents available within the parent dataset rather than a pre-specified target.
Sampling procedure and recruitment
Participants were recruited through institutional networks (colleges, hospitals and workplaces), community channels and digital platforms (e-mail, WhatsApp and social media), using purposive and snowball sampling. A total of 863 responses were recorded across all study sites, of which 414 originated from the Andaman and Nicobar Islands. Among the 581 students in the analytic subgroup, 322 (55.4%) were from the Andaman and Nicobar Islands and the remaining 259 were distributed across the other three sites and the pooled group. The survey was administered through a secure, fully anonymised online system and no personal identifiers were retained.
Measurements
Sleep quality was assessed using the Pittsburgh Sleep Quality Index (PSQI), a 19-item self-rated questionnaire covering the preceding month [6]. Its items generate seven component scores (subjective sleep quality, sleep latency, sleep duration, habitual sleep efficiency, sleep disturbances, use of sleeping medication and daytime dysfunction), each scored 0–3 and summed to a global score of 0–21, with a global score >5 denoting poor sleep quality [6]. Component scores were derived from raw items using the standard scoring algorithm; habitual sleep efficiency was calculated from reported sleep duration and estimated time in bed, with categorical bedtime, wake-time and duration options converted to interval midpoints.
Daytime sleepiness was assessed with the Epworth Sleepiness Scale (ESS), in which respondents rate their likelihood of dozing in eight everyday situations from 0 (would never doze) to 3 (high chance of dozing), giving a total score of 0–24 [7]. A score ≥10 was taken to denote excessive daytime sleepiness.
Depressive symptoms were assessed with the Patient Health Questionnaire-9 (PHQ-9), which rates the frequency of nine depressive symptoms over the preceding two weeks from 0 (not at all) to 3 (nearly every day), giving a total score of 0–27 [8]. A score ≥10 was taken to denote clinically significant depressive symptoms; in the original validation study this cut-off had a sensitivity and specificity of 88% for major depression [8]. The ninth item, which asks about thoughts of being better off dead or of hurting oneself, was examined separately as an indicator of passive suicidal ideation.
Perceived stress was assessed using the 10-item Perceived Stress Scale (PSS-10), which asks about feelings and thoughts during the preceding month; each item is rated from 0 (never) to 4 (very often), items 4, 5, 7 and 8 are reverse-scored, and total scores range from 0 to 40, with higher scores indicating greater perceived stress [9].
Total daily screen time (phone, television and computer or laptop combined) was recorded as a single ordered categorical item with five response options (less than 2 hours, 2–4 hours, 4–6 hours, 6–8 hours and more than 8 hours). Screen use in the hour before bed was recorded as a single ordered categorical item with four response options (avoids screens before bed, less than 30 minutes, 30–60 minutes and usually falls asleep with a screen on). Habitual sleep duration was self-reported in hours. In addition to these items and the four standardised instruments, the questionnaire recorded sociodemographic characteristics, including age, gender, occupation and study site. The questionnaire was administered in English.
Study variables
The primary outcomes were poor sleep quality (PSQI >5), excessive daytime sleepiness (ESS ≥10) and depressive symptoms (PHQ-9 ≥10). The primary exposure was pre-bedtime screen-use category, with avoiding screens before bed as the reference category; total daily screen-time category was examined as a secondary exposure. Gender and study site were included as covariates. Established thresholds from the validation literature were used to dichotomise each outcome, so that prevalence estimates would be comparable with those of other studies using the same instruments. Continuous PSQI, ESS, PHQ-9 and PSS-10 scores were used in correlation analyses.
Bias
Standardised, self-administered, validated instruments with established scoring rules were used to reduce measurement error and responses were collected anonymously to reduce social-desirability bias. Selection bias arising from non-probability online recruitment could not be excluded and is considered in the Discussion section.
Statistical analysis
Categorical variables are presented as n (%) and continuous scale scores as mean (standard deviation, SD). Chi-square tests were used to compare the prevalence of each binary outcome across screen-time categories and to compare the distribution of screen-time categories by gender. Spearman rank correlation coefficients (rho) were used to examine associations of the ordinal screen-time categories with continuous PSQI, ESS, PHQ-9 and PSS-10 scores, the correlation between the two screen-time measures and the inter-correlations among the four scales. Rank-based correlation was chosen because both screen-time measures were ordinal and scale scores are bounded summary scores that need not be normally distributed.
Separate multivariable binary logistic regression models were fitted for poor sleep quality, excessive daytime sleepiness and depressive symptoms, with pre-bedtime screen-use category as the exposure (reference: avoids screens before bed) and gender (reference: female) and study site (reference: Delhi) as covariates; models were fitted on participants who reported their gender (n = 577). Pre-bedtime screen use was entered as a four-level categorical variable using indicator coding, and study site as a categorical variable (four sites and the pooled group), so that no linear trend was imposed on either. Results are expressed as adjusted odds ratios (aOR) with 95% confidence intervals (CI). Total daily screen time was examined in bivariate analyses. A two-sided p-value <0.05 was considered statistically significant. Analyses were performed in Python 3.12 (Python Software Foundation) using the pandas, SciPy and statsmodels libraries.
Ethical considerations
The study protocol was approved by the Institutional Ethics Committee of the Andaman and Nicobar Islands Institute of Medical Sciences (ANIIMS), Sri Vijaya Puram (approval reference F. No. 1-366/ANIIMS/IEC/2026, dated 05 June 2026), and the study was conducted in accordance with the Indian Council of Medical Research National Ethical Guidelines for Biomedical and Health Research Involving Human Participants (10). Written informed electronic consent was obtained from all participants before enrolment and no personal identifiers were retained in the analytic dataset.
Results
Participant characteristics
All 581 participants in the analytic subgroup were aged 18–24 years and self-identified as students. Of these, 358 (61.6%) were female, 219 (37.7%) were male and 4 (0.7%) preferred not to disclose their gender. Most respondents (322, 55.4%) were from the Andaman and Nicobar Islands, followed by Delhi (148, 25.5%), Jammu and Kashmir (65, 11.2%), Rajasthan (17, 2.9%) and the pooled group of other states and union territories (29, 5.0%) (Table 1).
| Characteristic | n (%) |
| Gender | |
| Female | 358 (61.6) |
| Male | 219 (37.7) |
| Prefer not to say | 4 (0.7) |
| Study site | |
| Andaman and Nicobar Islands | 322 (55.4) |
| Delhi | 148 (25.5) |
| Jammu and Kashmir | 65 (11.2) |
| Rajasthan | 17 (2.9) |
| Other states and union territoriesa | 29 (5.0) |
| Total daily screen time | |
| Less than 2 hours | 20 (3.4) |
| 2–4 hours | 105 (18.1) |
| 4–6 hours | 190 (32.7) |
| 6–8 hours | 174 (29.9) |
| More than 8 hours | 92 (15.8) |
| Screen use in the hour before bed | |
| Avoids screens before bed | 36 (6.2) |
| Less than 30 minutes | 151 (26.0) |
| 30–60 minutes | 303 (52.2) |
| Usually falls asleep with a screen on | 91 (15.7) |
Values are number (%) of respondents.
aPooled group of states and union territories, each contributing fewer than ten respondents.
Screen-time patterns
The most common categories of total daily screen time were 4–6 hours (190, 32.7%) and 6–8 hours (174, 29.9%), and 92 respondents (15.8%) reported more than 8 hours per day, whereas only 20 (3.4%) reported less than 2 hours. In the hour before bed, 303 respondents (52.2%) used screens for 30–60 minutes and 91 (15.7%) usually fell asleep with a screen on, whereas only 36 (6.2%) avoided screens before bed (Table 1). The two screen-time measures were moderately correlated (rho=0.369, p<0.001), indicating that they capture related but distinct aspects of screen exposure. Total daily screen time differed significantly by gender (chi-square=14.84, degrees of freedom [df]=4, p=0.005), with a larger proportion of male than female respondents reporting more than 8 hours of daily screen use (46 of 219 [21.0%] versus 45 of 358 [12.6%]). Pre-bedtime screen use did not differ significantly by gender (chi-square=2.05, df=3, p=0.561).
Sleep quality, daytime sleepiness and depressive symptoms
Mean (SD) scores were 6.20 (3.19) for the PSQI, 7.05 (4.66) for the ESS, 7.22 (6.25) for the PHQ-9 and 19.18 (5.72) for the PSS-10. Mean (SD) self-reported sleep duration was 6.22 (1.30) hours, and 440 respondents (75.7%) slept fewer than seven hours per night. Poor sleep quality was present in 319 respondents (54.9%), excessive daytime sleepiness in 157 (27.0%) and depressive symptoms in 181 (31.2%). Passive suicidal ideation on the ninth PHQ-9 item was reported by 179 respondents (30.8%). All four scales were significantly and positively inter-correlated (rho 0.303 to 0.600, all p<0.001); the correlation between PSQI and PHQ-9 scores was rho=0.519.
Bivariate associations
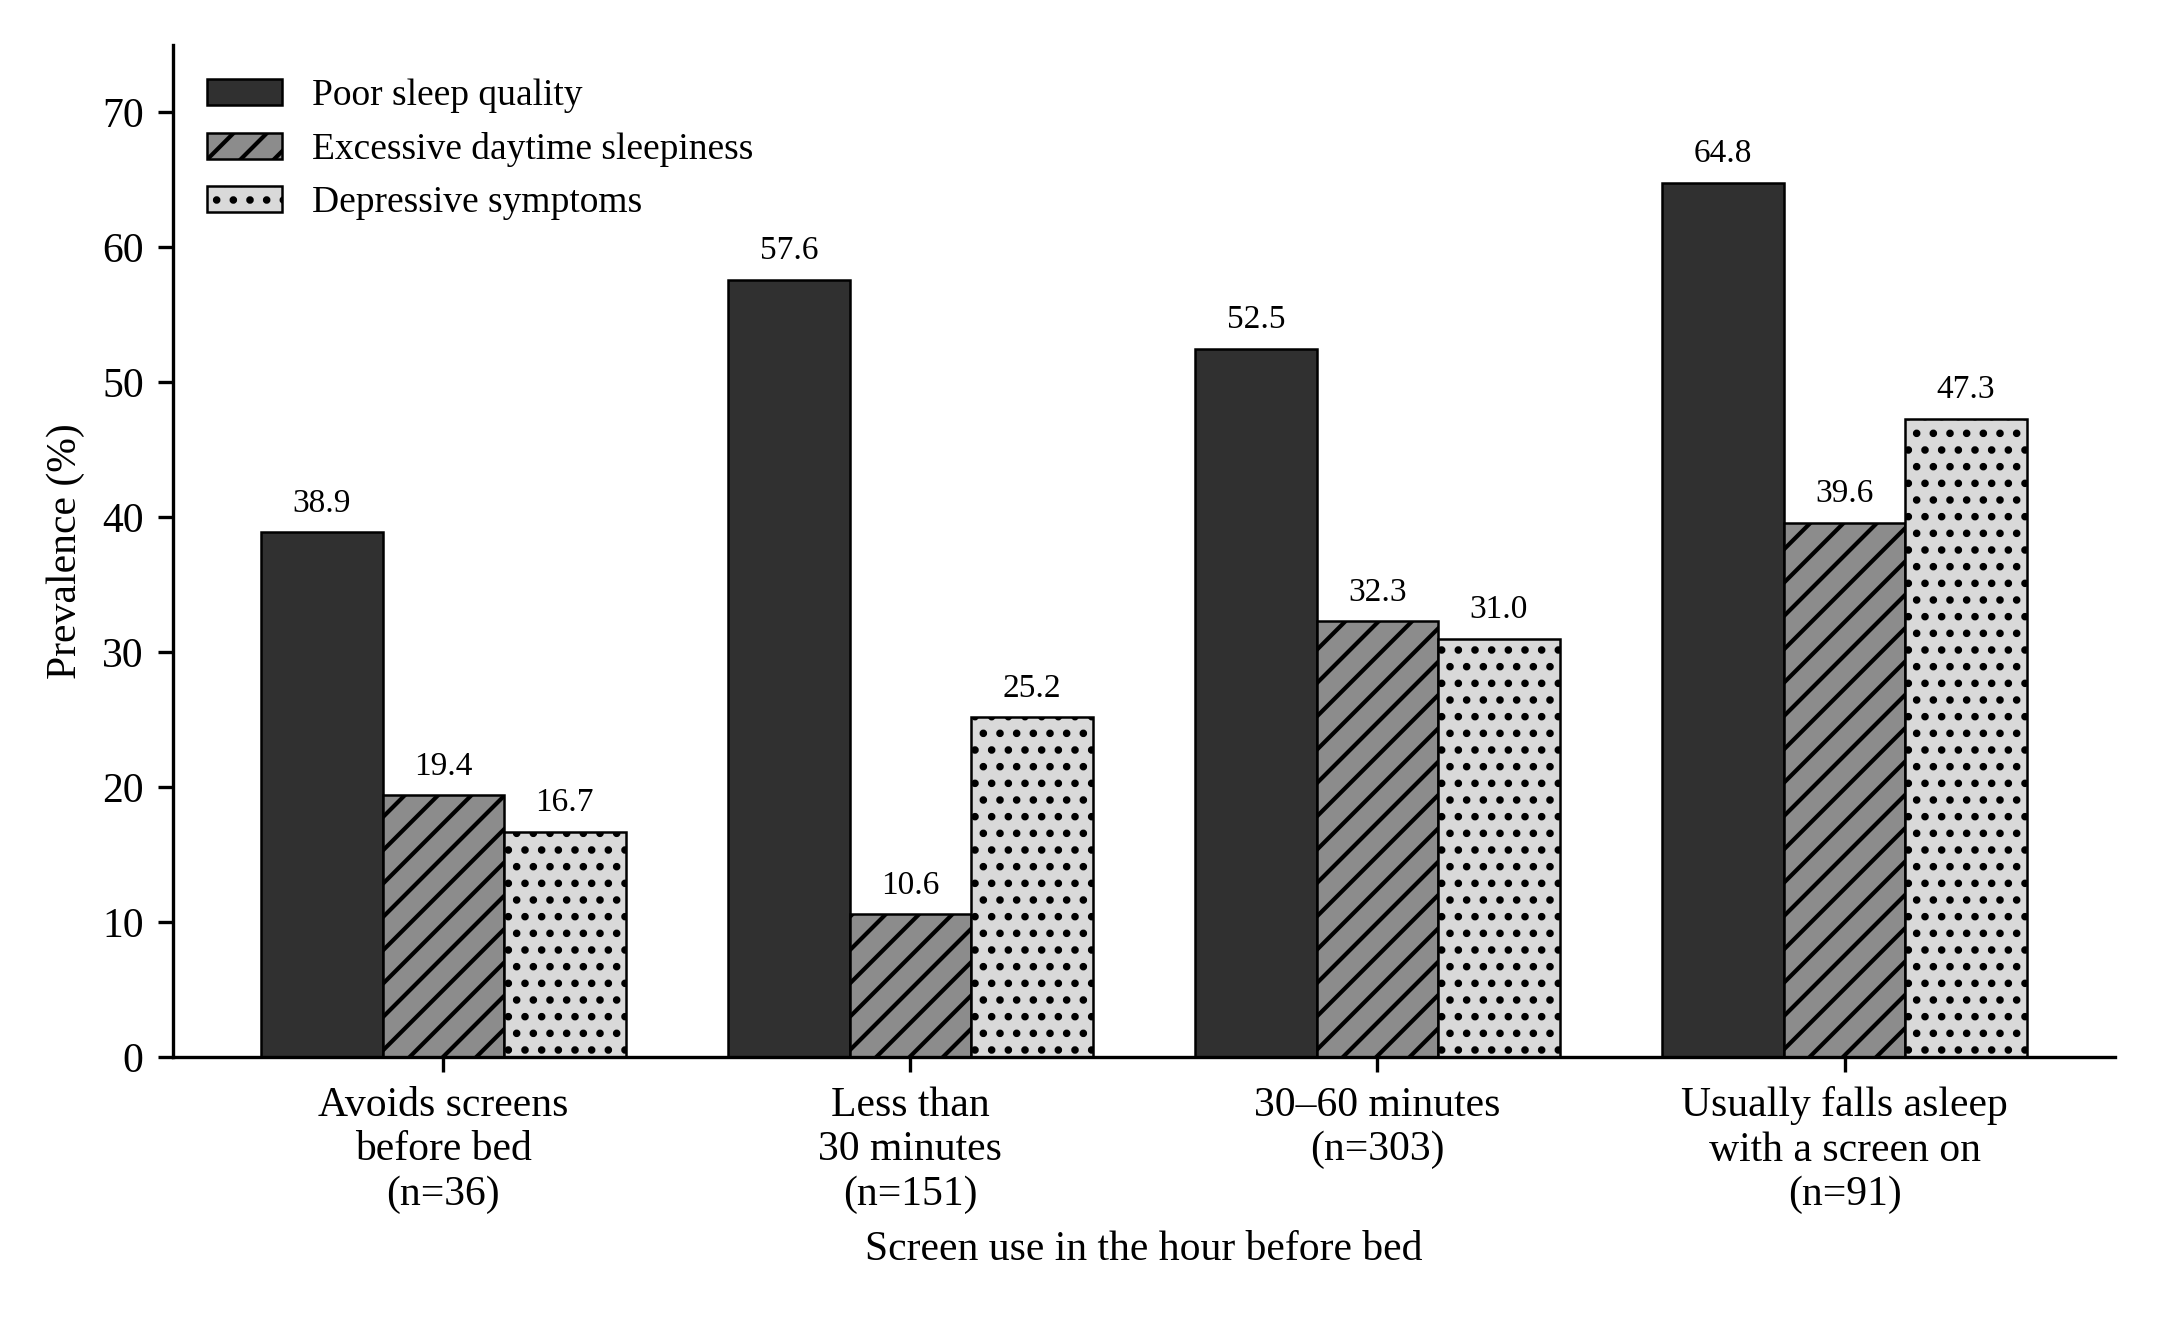
Total daily screen time was not significantly associated with poor sleep quality (p=0.521) or depressive symptoms (p=0.114), but was significantly associated with excessive daytime sleepiness (p<0.001), the prevalence of which rose from 15.0% among those reporting less than 2 hours per day to 38.0% among those reporting more than 8 hours (Table 2). Across the five categories of total daily screen time, the prevalence of poor sleep quality varied only between 51.6% and 62.0%, and that of depressive symptoms between 26.7% and 41.3%, without a consistent pattern.
Pre-bedtime screen use was significantly associated with all three outcomes and in each case prevalence was highest among respondents who usually fell asleep with a screen on (Table 2, Figure 1). Compared with respondents who avoided screens before bed, those who fell asleep with a screen on had a higher prevalence of poor sleep quality (59 of 91 [64.8%] versus 14 of 36 [38.9%]; p=0.036), excessive daytime sleepiness (36 of 91 [39.6%] versus 7 of 36 [19.4%]; p<0.001) and depressive symptoms (43 of 91 [47.3%] versus 6 of 36 [16.7%]; p<0.001). The pattern across the intermediate categories was not strictly monotonic; for example, excessive daytime sleepiness was least prevalent among respondents who used screens for less than 30 minutes before bed (10.6%). Passive suicidal ideation rose from 13.9% (5 of 36) among respondents who avoided screens before bed to 49.5% (45 of 91) among those who fell asleep with a screen on (p<0.001).
Spearman correlations were consistent with these findings. Pre-bedtime screen use was significantly correlated with PSQI, ESS, PHQ-9 and PSS-10 scores (all p≤0.010), whereas total daily screen time was significantly correlated with ESS and PHQ-9 scores (p≤0.001) but not with PSQI or PSS-10 scores.
| Screen-time category (n) | Poor sleep qualitya | Excessive daytime sleepinessb | Depressive symptomsc |
| Total daily screen time | |||
| Less than 2 hours (20) | 12 (60.0) | 3 (15.0) | 6 (30.0) |
| 2–4 hours (105) | 55 (52.4) | 20 (19.0) | 28 (26.7) |
| 4–6 hours (190) | 98 (51.6) | 38 (20.0) | 51 (26.8) |
| 6–8 hours (174) | 97 (55.7) | 61 (35.1) | 58 (33.3) |
| More than 8 hours (92) | 57 (62.0) | 35 (38.0) | 38 (41.3) |
| p-valued | 0.521 | <0.001* | 0.114 |
| Screen use in the hour before bed | |||
| Avoids screens before bed (36) | 14 (38.9) | 7 (19.4) | 6 (16.7) |
| Less than 30 minutes (151) | 87 (57.6) | 16 (10.6) | 38 (25.2) |
| 30–60 minutes (303) | 159 (52.5) | 98 (32.3) | 94 (31.0) |
| Usually falls asleep with a screen on (91) | 59 (64.8) | 36 (39.6) | 43 (47.3) |
| p-valued | 0.036* | <0.001* | <0.001* |
| Total (581) | 319 (54.9) | 157 (27.0) | 181 (31.2) |
Values are number (%) of respondents within each screen-time category who met the outcome definition.
aPittsburgh Sleep Quality Index global score >5. bEpworth Sleepiness Scale score ≥10. cPatient Health Questionnaire-9 score ≥10. dChi-square test. *p<0.05.
Multivariable analysis
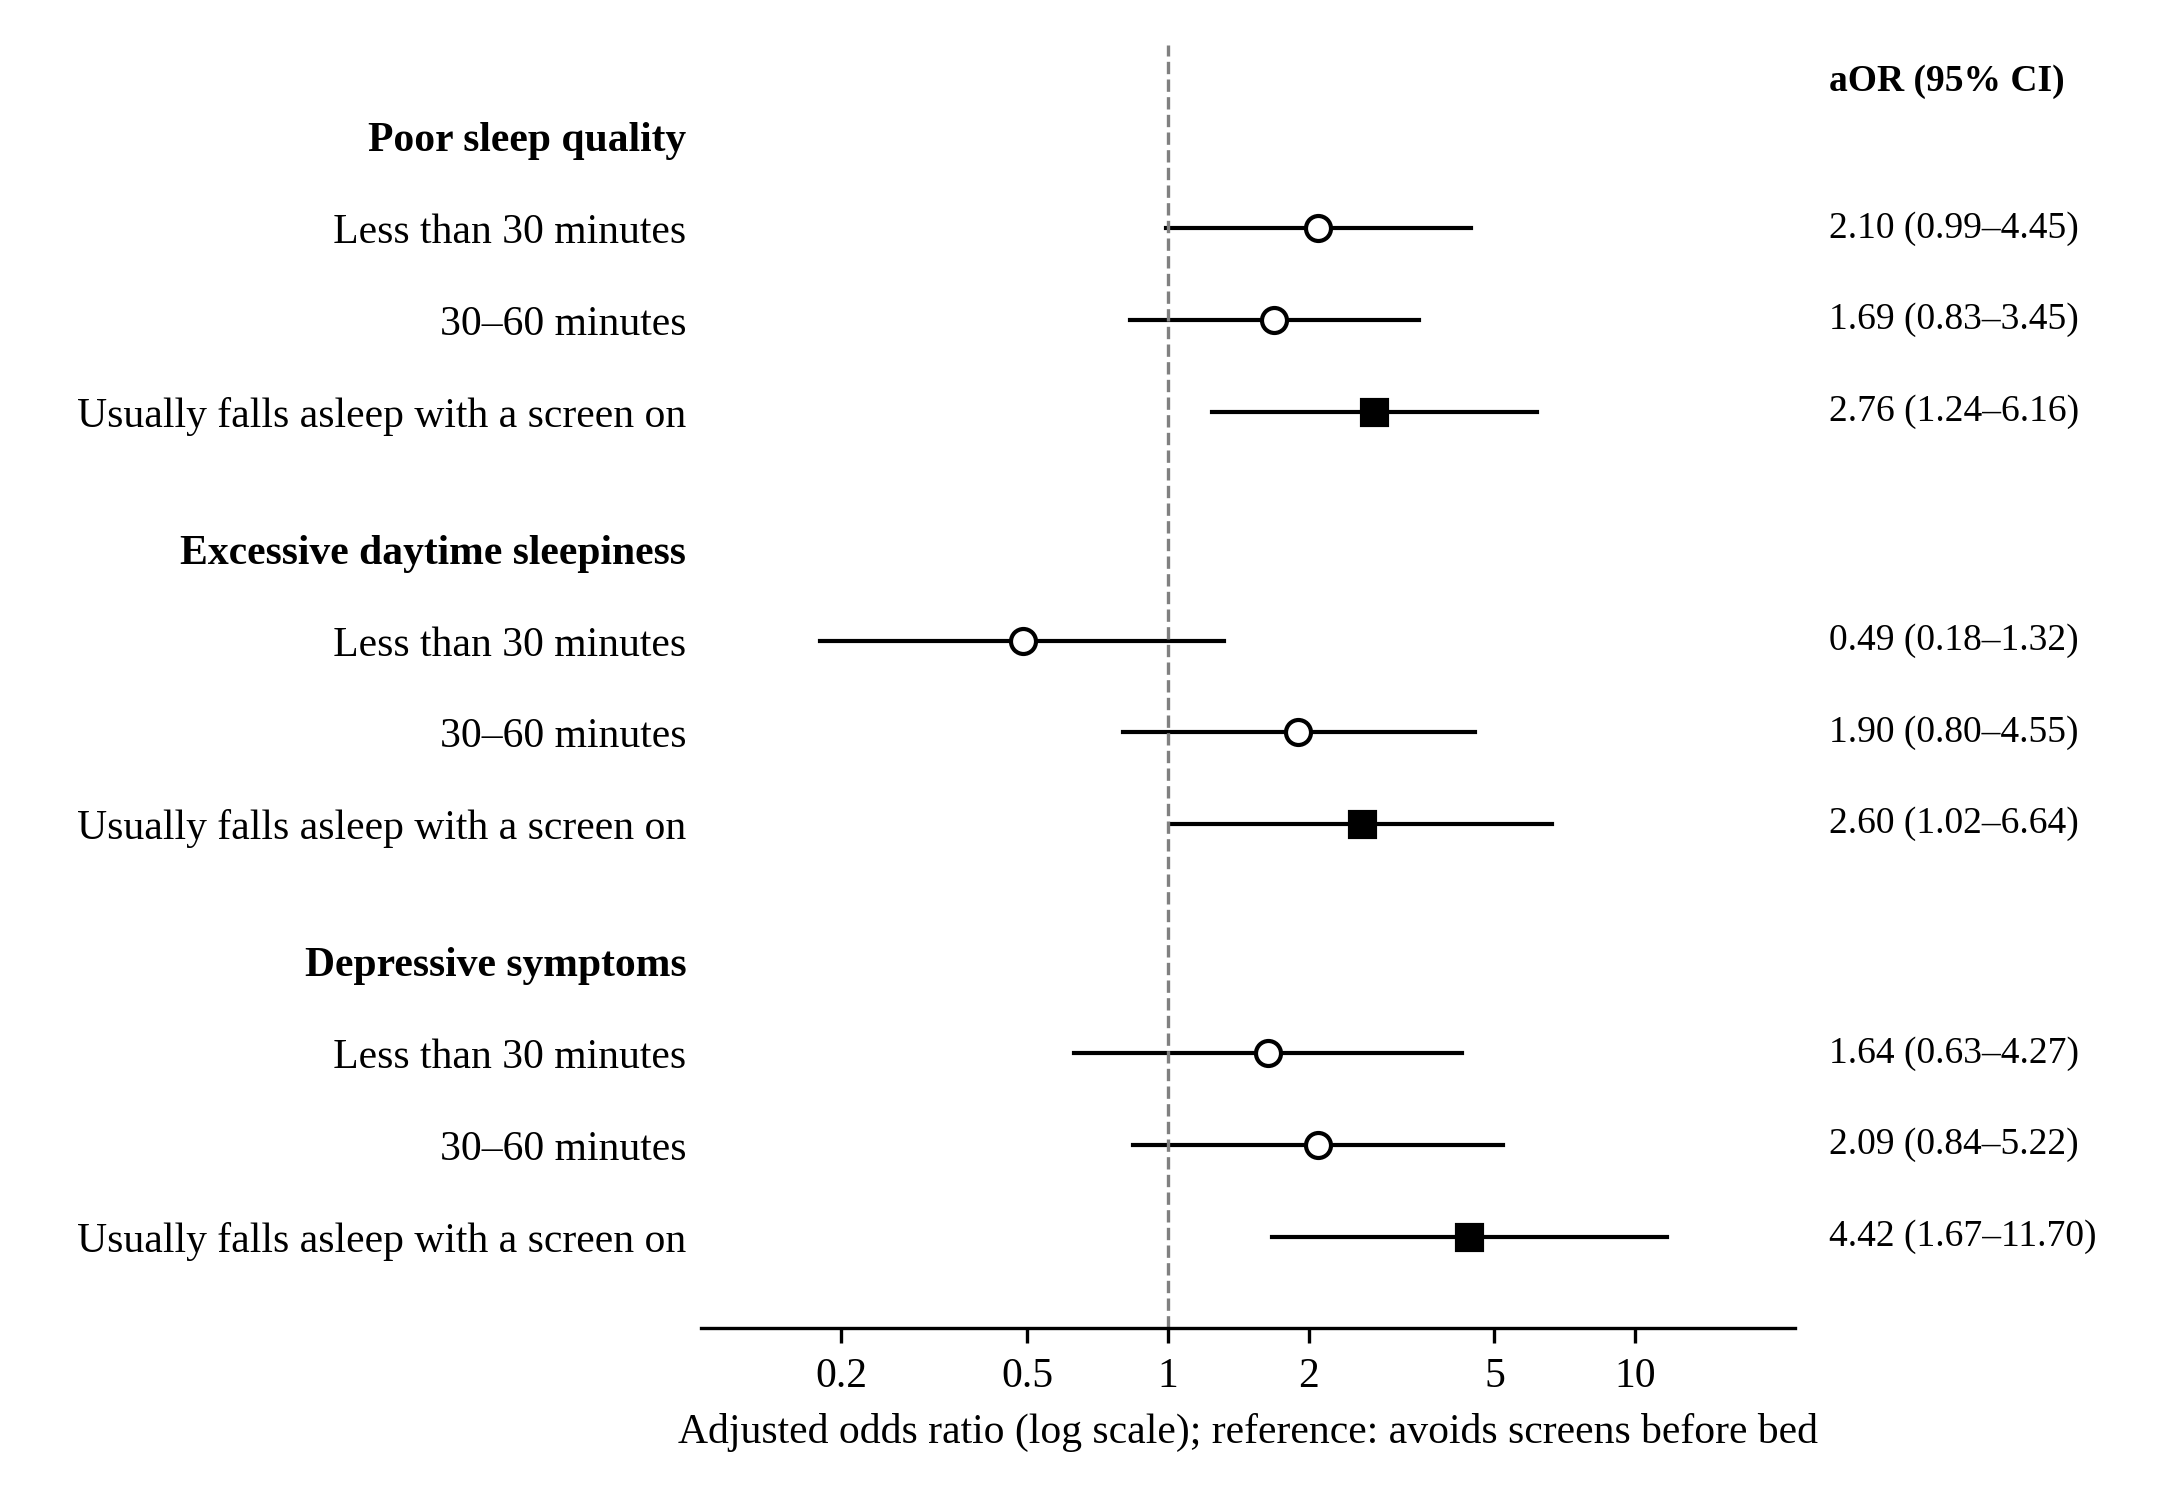
After adjustment for gender and study site (N=577), falling asleep with a screen on, relative to avoiding screens before bed, was independently associated with higher odds of poor sleep quality (aOR 2.76, 95% CI 1.24–6.16, p=0.013), excessive daytime sleepiness (aOR 2.60, 95% CI 1.02–6.64, p=0.046) and depressive symptoms (aOR 4.42, 95% CI 1.67–11.70, p=0.003) (Table 3, Figure 2). Screen use for less than 30 minutes before bed showed a borderline, non-significant association with poor sleep quality (aOR 2.10, 95% CI 0.99–4.45, p=0.052), and screen use for 30–60 minutes was not significantly associated with any outcome. Male gender was not independently associated with poor sleep quality (aOR 1.20, 95% CI 0.84–1.71, p=0.317) or depressive symptoms (aOR 0.85, 95% CI 0.58–1.26, p=0.423), and showed a non-significant trend towards higher odds of excessive daytime sleepiness (aOR 1.46, 95% CI 0.98–2.19, p=0.065). Study site was not independently associated with the outcomes, except that respondents from Jammu and Kashmir had higher odds of depressive symptoms than those from Delhi (aOR 2.09, 95% CI 1.13–3.87, p=0.019).
| Outcome and variable | aOR | 95% CI | p-value |
| Poor sleep qualitya | |||
| Avoids screens before bed | 1.00 | Reference | – |
| Less than 30 minutes | 2.10 | 0.99–4.45 | 0.052 |
| 30–60 minutes | 1.69 | 0.83–3.45 | 0.149 |
| Usually falls asleep with a screen on | 2.76 | 1.24–6.16 | 0.013* |
| Male genderd | 1.20 | 0.84–1.71 | 0.317 |
| Excessive daytime sleepinessb | |||
| Avoids screens before bed | 1.00 | Reference | – |
| Less than 30 minutes | 0.49 | 0.18–1.32 | 0.158 |
| 30–60 minutes | 1.90 | 0.80–4.55 | 0.147 |
| Usually falls asleep with a screen on | 2.60 | 1.02–6.64 | 0.046* |
| Male genderd | 1.46 | 0.98–2.19 | 0.065 |
| Depressive symptomsc | |||
| Avoids screens before bed | 1.00 | Reference | – |
| Less than 30 minutes | 1.64 | 0.63–4.27 | 0.313 |
| 30–60 minutes | 2.09 | 0.84–5.22 | 0.115 |
| Usually falls asleep with a screen on | 4.42 | 1.67–11.70 | 0.003* |
| Male genderd | 0.85 | 0.58–1.26 | 0.423 |
| Study site: Jammu and Kashmire | 2.09 | 1.13–3.87 | 0.019* |
Separate multivariable logistic regression models for each outcome, adjusted for gender and study site. Four respondents who preferred not to disclose their gender were excluded.
aOR: adjusted odds ratio; CI: confidence interval. aPittsburgh Sleep Quality Index global score >5. bEpworth Sleepiness Scale score ≥10. cPatient Health Questionnaire-9 score ≥10. dReference: female. eReference: Delhi; estimates for the other study sites were not statistically significant for any outcome and are not shown. *p<0.05.
Discussion
In this multi-site sample of 581 young adult Indian students, falling asleep with a screen on was independently associated with approximately 2.6- to 4.4-fold higher odds of poor sleep quality, excessive daytime sleepiness and depressive symptoms compared with avoiding screens before bed. Total daily screen time, by contrast, was not associated with poor sleep quality or depressive symptoms in bivariate analysis, although it was associated with excessive daytime sleepiness. These findings suggest that the timing and context of screen exposure around sleep onset may be more relevant to student sleep and mental health than the cumulative volume of screen use across the day.
The association observed for pre-bedtime screen use is consistent with studies linking bedtime and in-bed screen use to poorer sleep among youths and college students [1,2] and with Indian and pooled international evidence linking excessive or problematic smartphone use to poor sleep in student populations [3,4]. The present study extends this evidence by distinguishing two dimensions of screen exposure within the same sample and by including students from a geographically isolated island setting alongside mainland sites.
Plausible mechanisms include blue-light-mediated suppression of melatonin secretion, cognitive and emotional arousal from screen content, and the displacement or fragmentation of sleep onset [1,2]. The stronger association among respondents who usually fell asleep with a screen on, relative to those who used screens only briefly before bed, may reflect a qualitatively different pattern of use in which screen engagement extends into, and directly disrupts, the sleep period rather than merely preceding it. The association with depressive symptoms is compatible with a bidirectional relationship. Prospective evidence indicates that short sleep duration is associated with a higher subsequent risk of depression [11], while low mood and rumination may in turn prolong pre-sleep screen engagement as a form of distraction or avoidance. The moderate positive correlation between PSQI and PHQ-9 scores in this sample (rho=0.519) is consistent with this interpretation, although the cross-sectional design cannot establish its direction. The association of total daily screen time with excessive daytime sleepiness, in the absence of an association with sleep quality, suggests that cumulative daytime screen exposure may act on daytime alertness through other pathways, such as sedentary behaviour or general fatigue, rather than through direct disruption of the sleep period; this interpretation remains speculative.
The magnitude of the associations deserves careful interpretation. Adjusted odds ratios of 2.60 to 4.42 represent moderate to large effects, but the confidence intervals were wide (for depressive symptoms, 1.67–11.70) and the lower limit for excessive daytime sleepiness approached unity (1.02). This imprecision largely reflects the small reference group, as only 36 respondents (6.2%) avoided screens before bed. The intermediate categories were not significantly associated with any outcome after adjustment, and the pattern across them was not strictly monotonic. Because total daily screen time was examined in bivariate analyses, the comparison between the two exposures rests largely on unadjusted associations and on the consistency of findings across outcomes, and should be interpreted accordingly. The moderate correlation between the two measures (rho=0.369) nevertheless indicates that they are not interchangeable.
These findings have implications for student health. Sleep-hygiene messaging for students may be more productively focused on disengaging from screens before and especially during, sleep than on broad reduction of total daily screen use. For student health services, primary care and academic counsellors, asking whether a student usually falls asleep with a screen on is a simple, low-resource question that may help identify students who warrant further assessment of sleep and mood. This may be particularly useful in geographically isolated settings such as the Andaman and Nicobar Islands, which contributed 322 (55.4%) of the respondents and where specialist mental-health referral pathways are comparatively limited. The higher odds of depressive symptoms among respondents from Jammu and Kashmir relative to Delhi (aOR 2.09) were not explained by the variables examined and merit further investigation. The finding that male students reported higher total daily screen time without a corresponding difference in pre-bedtime use suggests that the two exposures are shaped by partly distinct behavioural patterns and may warrant separate consideration in screen-use guidance.
This study has several strengths, including its multi-site design spanning geographically and infrastructurally diverse Indian settings, the inclusion of the Andaman and Nicobar Islands, an island population not previously represented in this literature to our knowledge, the use of multiple validated instruments and adjustment for gender and study site. Several limitations should also be considered. First, the cross-sectional design precludes causal inference and cannot establish the direction of the observed associations. Second, purposive and snowball sampling through online channels may have introduced selection bias, and site representation was unequal, with the Andaman and Nicobar Islands contributing more than half of the sample and Rajasthan only 17 respondents; the findings may therefore not be generalisable to all Indian students. Finally, no a priori sample-size calculation was performed for this sub-analysis, the small reference group limited the precision of the adjusted estimates, and the testing of several exposures and outcomes increases the possibility of chance findings. Longitudinal studies using objective measures of device use are needed to clarify the temporal relationship between pre-sleep screen behaviour, sleep and mental health in this population.
In conclusion, among young adult students surveyed across geographically diverse Indian sites, including the geographically isolated Andaman and Nicobar Islands, falling asleep with a screen on was more consistently associated with poor sleep quality, excessive daytime sleepiness and depressive symptoms than total daily screen time. These findings support directing student sleep-health messaging and screening towards specific pre-sleep screen behaviours rather than total screen exposure alone. The higher prevalence of passive suicidal ideation among students who fell asleep with a screen on further indicates that this simple question may help identify students who would benefit from mental-health assessment, particularly in under-studied and resource-constrained settings.
Declarations
Ethics approval and consent to participate
The study protocol was approved by the Institutional Ethics Committee of the Andaman and Nicobar Islands Institute of Medical Sciences (ANIIMS), Sri Vijaya Puram (approval reference F.No. 1-366/ANIIMS/IEC/2026, dated 05 June 2026). All participants provided written informed electronic consent before participation.
Consent for publication
Not applicable.
Availability of data and materials
The dataset analysed in this study is available from the corresponding author on reasonable request.
Conflict of interest
The authors have no conflicts of interest to declare.
Funding
Nil.
UN Declaration of Human Rights
All authors confirm that they accept and agree with the United Nations Universal Declaration of Human Rights.
Authors' contributions
Samar Hossain: conceptualisation, study design, methodology, data curation, formal analysis, writing – original draft and supervision. Shweta Goswami: methodology, coordination of data collection at the Delhi site and writing – review and editing. Aanchal Anand: data collection at the Andaman and Nicobar Islands site, data curation and writing – review and editing. Deepa Meena: methodology, coordination of data collection at the Rajasthan site, interpretation of results and writing – review and editing. Ukshan Shah: coordination of data collection at the Jammu and Kashmir site and writing – review and editing. Ajay Raj Sethuraman: data collection at the Andaman and Nicobar Islands site, investigation and writing – review and editing. Surbhi: data collection at the Andaman and Nicobar Islands site, literature review and writing – review and editing. All authors read and approved the final manuscript and agree to be accountable for all aspects of the work.
Acknowledgements
The authors express their sincere gratitude to all individuals who supported the study by disseminating the survey and spreading awareness. We extend special thanks to the coordinators and volunteers whose efforts were pivotal in achieving representation across all target states and union territories.