Introduction
Induction of labour (IOL) is frequently performed when the risks associated with continuing a pregnancy outweigh those of delivery. The effectiveness of this procedure hinges on various factors concerning the mother, fetus, and cervix, especially the extent of cervical ripening prior to induction. This is particularly critical in primigravida women, as nulliparity can significantly impact both the duration and outcomes of induced labour. A precise assessment before induction is vital for providing appropriate counselling to women, selecting induction methods, and forecasting the likelihood of operative delivery [1][2]. Labour induction rates have doubled in the past two decades globally, as noted by the American College of Obstetricians and Gynaecologists. However, induction is not risk-free, and its benefits must be weighed against potential maternal and fetal risks [3].
The Bishop score is a traditional clinical tool used to evaluate cervical favorability, considering factors such as cervical dilation, effacement, consistency, position, and fetal station. Despite its use, the digital assessment involved is subjective and often exhibits significant inter-observer variability. While higher Bishop scores typically correlate with an increased chance of vaginal delivery, systematic reviews have indicated that the score's predictive ability for outcomes of induced labor is generally modest or poor [4].
Ultrasonography provides an objective and non-invasive alternative for assessing cervical and fetal parameters before induction. Transvaginal or translabial ultrasonography can measure cervical length, cervical morphology and fetal head descent. Studies have demonstrated that cervical length may provide useful prediction of successful induction, with some investigations showing better discriminatory ability than the Bishop score. For example, a study of 177 women reported cervical length as a better predictor of successful induction than Bishop score, with a useful cutoff of approximately 24 mm [5].
In primigravida women specifically, translabial ultrasound assessment of cervical length and fetal head–pubis symphysis distance has demonstrated promising predictive performance. One study reported sensitivities of 90% for cervical length and 88% for fetal head–pubis symphysis distance, compared with 84% for Bishop score [1]. More recent evidence indicates that fetal head–perineum distance and posterior cervical angle may also contribute to prediction of induction outcomes, although the predictive performance varies between studies [6].
Despite promising findings regarding ultrasound measurements, systematic reviews indicate variability in these measurements, cut-off values, and overall predictive accuracy. This suggests a need for further evaluation in well-defined populations [7]. The current study aims to assess ultrasonographic cervical parameters for predicting the mode of delivery in primigravida women following labor induction. Additionally, it seeks to compare the predictive performance of these ultrasound parameters against conventional clinical cervical assessments.
The study aims to evaluate the role of ultrasonographic cervical parameters in predicting delivery methods following labor induction in primigravida women. Objectives include assessing selected cervical parameters prior to induction, determining their correlation with successful vaginal delivery versus caesarean section, and identifying which ultrasonographic parameters may predict successful vaginal delivery after induction.
Methods
This prospective observational cross-sectional study was conducted in the Department of Obstetrics and Gynaecology, Uttar Pradesh University of Medical Sciences, Saifai, Etawah, over a period of one year. A total of 200 primigravida women were enrolled according to predefined eligibility criteria. Twenty women were subsequently excluded because of not giving consent, failed induction, or caesarean delivery for acute fetal distress before effective uterine contractions. Thus, 180 women completed the study and were followed until delivery. Eligible participants had singleton cephalic pregnancies at ≥37 weeks with an adequate pelvis and were planned for induction of labour. Women with multiparity, active labour, placenta previa, malpresentation, previous caesarean section/myomectomy, uncontrolled chronic hypertension, estimated fetal weight ≥4 kg, or NYHA III/IV heart disease were excluded. Ethical approval and written informed consent were obtained.
Following induction, participants were classified according to mode of delivery into normal vaginal delivery (Group 1, n=100), assisted vaginal delivery (Group 2, n=20), and LSCS (Group 3, n=60). Maternal and fetal parameters were assessed before induction using ultrasonography.
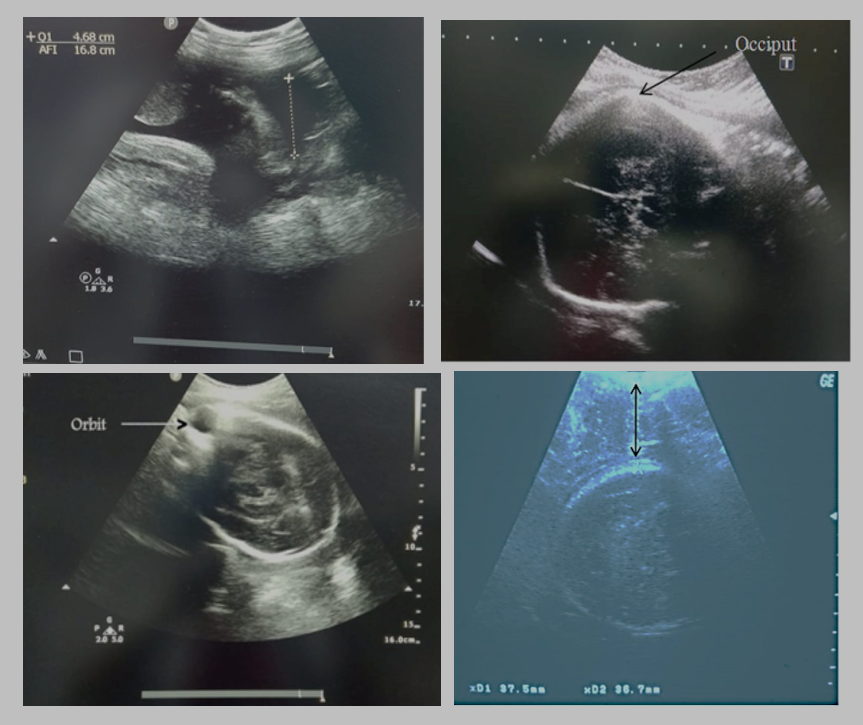
Transabdominal sonography was used to assess estimated fetal body weight (EFBW), fetal head position and amniotic fluid index (AFI). EFBW was calculated using Hadlock’s formula from BPD, HC, AC and FL measurements. AFI was determined by measuring the deepest vertical pocket in each of four uterine quadrants and summing the values. Fetal head position was assessed by identifying the fetal occiput and orbital landmarks (Figure 1).
Transvaginal sonography was performed to measure cervical length as the linear distance between the internal and external cervical os. Transperineal sonography was performed in the supine position with flexed legs and an empty bladder. The perineal-head distance (PHD) was measured as the shortest distance between the outer bony margin of the fetal skull and the skin surface of the perineum. Such ultrasound measurements provide objective assessment of cervical and fetal-head parameters before induction.
The statistical analysis of results was done by using SPSS Versions 21 statistical analysis Software. Discrete (categorical) data were summarized as in proportions and percentages (%) and Mean ± SD (standard deviation). All the categorical data was compare by using chi square test. Continuous variables in two groups were compared by t- test. More than two variables were analyzed by one way ANOVA. The Sensitivity and specificity were used for diagnosis of predicting vaginal delivery. The p-value <0.05 was considered as significant. The statistical analysis was done using SPSS 21.0 version (Chicago, Inc., USA) windows software.
Results
Total 180 participants were categorized based on their mode of delivery into three groups: normal vaginal delivery (Group 1, n=100), assisted vaginal delivery (Group 2, n=20), and lower segment cesarean section (LSCS) (Group 3, n=60). Prior to induction, maternal and fetal parameters were evaluated using ultrasonography. The comparison shows that the three groups were broadly comparable with respect to age, BMI, gestational age, and residence, with no statistically significant differences (p>0.05). Most participants were aged 21–30 years, and the majority had a BMI of 18.5–24.9 kg/m². Gestational age distribution was also similar across groups. However, birth weight differed significantly among the groups (p=0.024), with low birth weight (≤2.5 kg) being more frequent in Group 2 (40.0%) than Group 1 (20.0%) and Group 3 (13.3%). Urban residence predominated in all groups, with no significant difference (p=0.65) (Table 1).
| Variable | Category | Group 1 (n=100) n (%) | Group 2 (n=20) n (%) | Group 3 (n=60) n (%) | p-value |
| Age (years) | ≤20 | 5 (5.0%) | 0 (0%) | 2 (3.3%) | 0.808 |
| 21–30 | 90 (90.0%) | 18 (90.0%) | 56 (93.3%) | ||
| >30 | 5 (5.0%) | 2 (10.0%) | 2 (3.3%) | ||
| BMI (kg/m²) | <18.5 | 0 (0%) | 0 (0%) | 0 (0%) | 0.82 |
| 18.5–24.9 | 60 (60.0%) | 9 (45.0%) | 32 (53.3%) | ||
| ≥25 | 40 (40.0%) | 11 (55.0%) | 28 (46.7%) | ||
| Gestational age Birth weight (kg) | 37 wk- 37wk6d | 25 (25.0%) | 5 (25.0%) | 20 (33.3%) | 0.64 |
| 38–38 weeks6d | 18 (18.0%) | 5 (25.0%) | 7 (11.7%) | ||
| 39–39 weeks6d | 22 (22.0%) | 5 (25.0%) | 19 (31.7%) | ||
| 40–40 weeks6d | 27 (27.0%) | 4 (20.0%) | 8 (13.3%) | ||
| ≥41 weeks | 8 (8.0%) | 1 (5.0%) | 6 (10.0%) | ||
| ≤2.5 | 20 (20.0%) | 8 (40.0%) | 8 (13.3%) | 0.024* | |
| >2.5 | 80 (80.0%) | 12 (60.0%) | 52 (86.7%) | ||
| Residence | Urban | 90 (90.0%) | 17 (85.0%) | 49 (81.7%) | 0.65 |
| Rural | 10 (10.0%) | 3 (15.0%) | 11 (18.3%) |
* p < 0.05, statistically significant.
Postdatism was the most common indication for induction in Group 1 (32.0%), whereas hypertensive disorders of pregnancy were prominent in Group 3 (28.3%). IHCP accounted for 18.0%, 20.0%, and 26.7% of cases in Groups 1, 2, and 3, respectively. PROM was observed in 18.0% of Group 1, 25.0% of Group 2, and 11.7% of Group 3. Decreased fetal movements, GDM/overt diabetes, and FGR constituted smaller proportions across all groups. Overall, there was no statistically significant difference in the indications for induction among the three groups (p=0.116), suggesting that the underlying indications were broadly comparable (Table 2).
| Indication of induction | Group 1 (n=100) n (%) | Group 2 (n=20) n (%) | Group 3 (n=60) n (%) | p-value |
| Postdatism | 32 (32.0%) | 5 (25.0%) | 10 (16.7%) | 0.116 |
| IHCP | 18 (18.0%) | 4 (20.0%) | 16 (26.7%) | |
| PROM | 18 (18.0%) | 5 (25.0%) | 7 (11.7%) | |
| Hypertensive disorder of pregnancy | 15 (15.0%) | 0 (0%) | 17 (28.3%) | |
| Decreased FM | 5 (5.0%) | 3 (15.0%) | 2 (3.3%) | |
| GDM/overt diabetes | 8 (8.0%) | 1 (5.0%) | 6 (10.0%) | |
| FGR | 4 (4.0%) | 2 (10.0%) | 2 (3.3%) |
The comparisons of clinical vaginal examination among study groups are shown in Table 3. The mean effacement (%), cervical dilatation (cm) and BISHOP Score were 25.45±3.44, 1.90±0.84 and 2.92±0.85 in group 1, 20.63±3.33, 1.5±0.81 and 3.16±0.83 in group 2 and 16.94±7.75, 1.00±0.79 and 2.92±0.80 in group 3, respectively. The effacement (%) was significantly higher in group 1 as compared to group 2 and group 3. The BISHOP Score was significantly higher in group 2 as compared to group 1 and group 2. The mean cervical dilatation (cm) was comparable in between groups (Table 3).
| Group 1 (n=100) | Group 2 (n=20) | Group 3 (n=60) | p-value | ||||
| Mean | SD | Mean | SD | Mean | SD | ||
| Effacement (%) | 25.45 | 3.44 | 20.63 | 3.33 | 16.94 | 7.75 | 0.001* |
| Cervical dilatation (cm) | 1.90 | 0.84 | 1.5 | 0.81 | 1.00 | 0.79 | 0.077 |
| BISHOP Score | 2.92 | 0.85 | 3.16 | 0.83 | 2.92 | 0.80 | 0.005* |
*=Significant (p<0.05)
The clinical vaginal examination findings showed significant differences in cervical position and Bishop score among the three study groups. Posterior cervical position was more frequent in Group 3 (71.7%) compared with Group 1 (50.0%) and Group 2 (40.0%), while mid-position was predominant in Group 2 (60.0%), with the difference being statistically significant (p=0.008). Cervical consistency did not differ significantly between groups (p=0.069); however, a soft cervix was most commonly observed in Group 1 (50.0%). Head station was comparable among the groups (p=0.829), with station −3 being the most frequent finding in all three groups. Bishop score distribution demonstrated a statistically significant difference (p=0.005). Scores of 3 were most common in Group 3 (48.3%), followed by Group 2 (45.0%) and Group 1 (40.0%). Overall, the findings indicate significant variation in cervical position and cervical favorability among the groups. (Table 4).
| Clinical vaginal examination | Category | Group 1 (n=100) n (%) | Group 2 (n=20) n (%) | Group 3 (n=60) n (%) | p-value |
| Consistency | Firm | 12 (12.0%) | 7 (35.0%) | 11 (18.3%) | 0.069 |
| Medium | 38 (38.0%) | 8 (40.0%) | 23 (38.3%) | ||
| Soft | 50 (50.0%) | 5 (25.0%) | 26 (43.3%) | ||
| Cervical position | Posterior | 50 (50.0%) | 8 (40.0%) | 43 (71.7%) | 0.008* |
| Mid-position | 50 (50.0%) | 12 (60.0%) | 16 (26.7%) | ||
| Anterior | 0 (0%) | 0 (0%) | 1 (1.7%) | ||
| Head station | −5 | 2 (2.0%) | 1 (5.0%) | 3 (5.0%) | 0.829 |
| −4 | 30 (30.0%) | 5 (25.0%) | 16 (26.7%) | ||
| −3 | 50 (50.0%) | 11 (55.0%) | 34 (56.7%) | ||
| −2 | 15 (15.0%) | 3 (15.0%) | 7 (11.7%) | ||
| −1 | 0 (0%) | 0 (0%) | 0 (0%) | ||
| Bishop score | 1 | 3 (3.0%) | 0 (0%) | 1 (1.7%) | 0.005* |
| 2 | 30 (30.0%) | 4 (20.0%) | 16 (26.7%) | ||
| 3 | 40 (40.0%) | 9 (45.0%) | 29 (48.3%) | ||
| 4 | 25 (25.0%) | 5 (25.0%) | 13 (21.7%) | ||
| 5 | 2 (2.0%) | 2 (10.0%) | 1 (1.7%) |
*Significant (p<0.05).
The ultrasound findings demonstrated significant differences among the study groups in perineal head distance, cervical length, estimated fetal birth weight (EFBW), and fetal head position. Perineal head distance was predominantly 31–40 mm in Group 1 (70.0%), whereas 41–50 mm was more frequent in Groups 2 and 3, with a highly significant difference (p<0.001). Cervical length also differed significantly (p=0.001), with 2.6–3.0 cm being most common in Groups 1 and 2, while >3 cm was more frequent in Group 3. EFBW showed a significant difference (p=0.002). AFI distribution was not statistically significant (p=0.235). Occipito-anterior fetal head position was most frequent in Group 1 (90.0%), whereas non-occipito-anterior position predominated in Groups 2 and 3, with a significant difference (p=0.001). Overall, several ultrasonographic parameters demonstrated significant intergroup variation (Table 5).
| USG Parameter | Category | Group 1 (n=100) n (%) | Group 2 (n=20) n (%) | Group 3 (n=60) n (%) | p-value |
| Perineal head distance (mm) | ≤30 | 1 (1.0%) | 0 (0%) | 2 (3.3%) | <0.001* |
| 31–40 | 70 (70.0%) | 11 (55.0%) | 23 (38.3%) | ||
| 41–50 | 28 (28.0%) | 9 (45.0%) | 32 (53.3%) | ||
| 51–60 | 1 (1.0%) | 0 (0%) | 3 (5.0%) | ||
| Cervical length (cm) | 2.0–2.5 | 28 (28.0%) | 3 (15.0%) | 8 (13.3%) | 0.001* |
| 2.6–3.0 | 65 (65.0%) | 14 (70.0%) | 31 (51.7%) | ||
| >3.0 | 7 (7.0%) | 3 (15.0%) | 21 (35.0%) | ||
| EFBW (g) | <2500 | 40 (40.0%) | 10 (50.0%) | 10 (16.7%) | 0.002* |
| 2500–3000 | 50 (50.0%) | 8 (40.0%) | 30 (50.0%) | ||
| >3000 | 10 (10.0%) | 2 (10.0%) | 20 (33.3%) | ||
| AFI (cm) | <5 | 2 (2.0%) | 0 (0%) | 2 (3.3%) | 0.235 |
| 5–10 | 65 (65.0%) | 15 (75.0%) | 35 (58.3%) | ||
| 10–20 | 37 (37.0%) | 5 (25.0%) | 23 (38.3%) | ||
| >20 | 0 (0%) | 0 (0%) | 0 (0%) | ||
| Fetal head position | Occipito-anterior | 90 (90.0%) | 9 (45.0%) | 22 (36.7%) | 0.001* |
| Non-occipito-anterior | 10 (10.0%) | 11 (55.0%) | 38 (63.3%) |
*Significant (p<0.05).
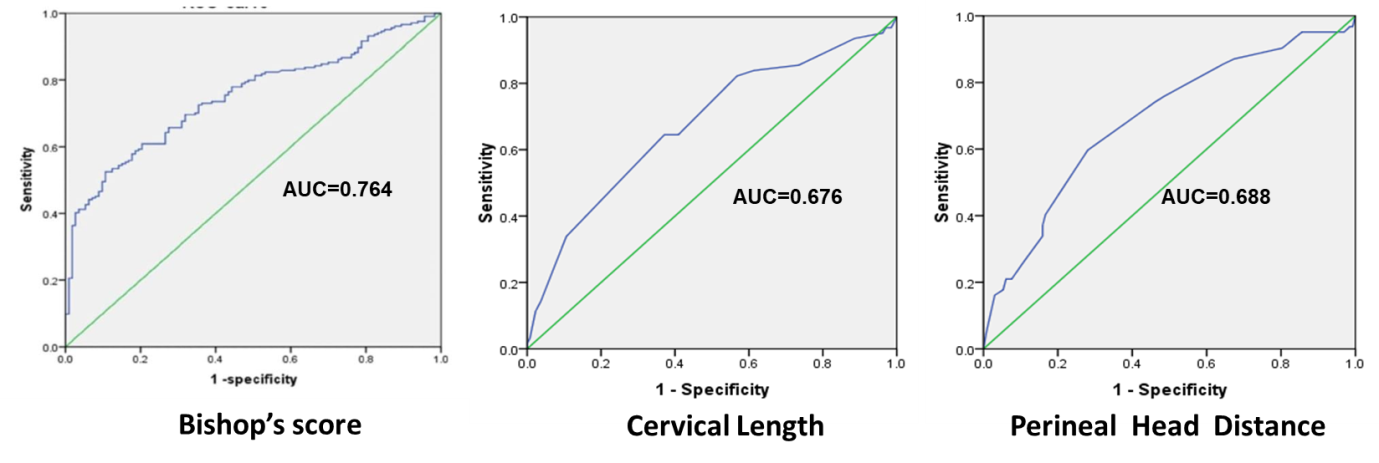
The sensitivity, specificity, and area under the curve were used to analysis the Bishop’s score, cervical length and Perineal head distance for predicting vaginal delivery (Table 6). The cut-off value for Bishop’s score, cervical length and Perineal head distance were ≥ 4, ≤2.5 cm and ≤41.6 mm, respectively to make a diagnosis of predicting vaginal delivery. With these cut-off values, Bishop’s score, cervical length and Perineal head distance had 74.67%, 85.0% and 91.0% sensitivity and 69.9%, 70.0% and 67.4% specificity in the diagnosis of vaginal delivery. These tests were demonstrating the accuracy of risk factors. Bishop’s score, cervical length and Perineal head distance were showed significant large area under the curve (AUC) on the ROC curve (Table 6) (Figure 2).
| Cut-off | Area under the curve | Standard Error | Sensitivity | Specificity | p-value | 95% Confidence Interval | ||
| Lower Bound | Upper Bound | |||||||
| Bishop’s score | ≥ 4 | 0.764 | 0.043 | 74.67% | 69.9% | 0.001* | 0.75 | 0.89 |
| Cervical length | ≤2.5 cm | 0.676 | 0.043 | 85.0% | 70.0% | 0.001* | 0.592 | 0.759 |
| Perineal head distance | ≤41.6 mm | 0.688 | 0.042 | 91.0% | 67.4% | <0.001* | 0.606 | 0.769 |
*Significant
Discussion
Induction of labor is a common obstetric procedure aimed at ensuring successful vaginal delivery when the benefits of expedited delivery surpass the risks of prolonging pregnancy, provided there are no contraindications. Current research is investigating ultrasound's role in predicting the mode of delivery post-induction as a more objective alternative to the traditional Bishop's score, which assesses cervical parameters, fetal head position, and station within the maternal pelvis. Studies indicate that an unfavorable cervix, a higher fetal head station, and an abnormal fetal head position correlate with increased risks of induction failure and cesarean delivery. Traditionally, these parameters were evaluated through digital vaginal examination, but ultrasound is emerging as a more straightforward and objective method, minimizing subjective influences.
The demographic characteristics of the three study groups were broadly comparable. Most participants were aged 21–30 years, comprising 90.0% in Groups 1 and 2 and 93.3% in Group 3, with no significant difference in age distribution (p=0.808). BMI distribution was also comparable (p=0.82), with normal BMI predominating in Group 1, while overweight participants were relatively more frequent in Groups 2 and 3. BMI showed no significant difference between groups (p=0.82), indicating it was unlikely to confound comparisons. However, prior evidence suggests that elevated BMI may negatively impact induction outcomes. Zelig et al., in “Interaction between maternal obesity and Bishop score in predicting successful induction of labor in term, nulliparous patients,” reported lower induction success among obese women, particularly when the initial Bishop score was low [8,9].
Gestational age showed no significant intergroup difference (p=0.64), although Group 3 had a higher proportion at 37–37⁶ weeks and 39–39⁶ weeks. Birth weight was the only demographic variable showing a statistically significant difference (p=0.024), with low birth weight (≤2.5 kg) more frequent in Group 2 (40.0%) than Groups 1 (20.0%) and 3 (13.3%). In the study “Mode of delivery and outcomes by birth weight among spontaneous and induced singleton cephalic nulliparous labors,” it was found that birth weight significantly influences the rate of caesarean delivery, with higher birth weights correlating to increased caesarean rates in both spontaneous and induced labour [10]. Residence distribution was similar across groups (p=0.65), with urban participants predominating. Overall, the groups were sufficiently comparable for most baseline characteristics, while birth-weight imbalance should be considered during interpretation.
The distribution of indications for induction varied across the three study groups, although the overall difference was not statistically significant (p=0.116). Postdatism was the most common indication in Group 1, accounting for 32.0% of cases, compared with 25.0% in Group 2 and 16.7% in Group 3. IHCP constituted 18.0%, 20.0%, and 26.7% of cases in Groups 1, 2, and 3, respectively, making it the second most frequent indication in Group 3. PROM was reported in 18.0% of Group 1, 25.0% of Group 2, and 11.7% of Group 3. Hypertensive disorders of pregnancy were more prominent in Group 3 (28.3%) compared with Group 1 (15.0%) and were absent in Group 2. Decreased fetal movements accounted for 5.0%, 15.0%, and 3.3%, respectively. GDM/overt diabetes and FGR represented smaller proportions across all groups. Overall, the indications were broadly comparable among the groups. In the HYPITAT trial, Koopmans et al. found that inducing labor at term for women with gestational hypertension or mild pre-eclampsia led to better maternal outcomes without increasing the risk of cesarean delivery [11]. Prolonged rupture of membranes (PROM) is a common reason for labor induction due to heightened risk of infection. The TERMPROM study supports planned induction as a suitable management approach for term PROM [12]. Ali et al., studied fetal head-perineum distance on transperineal ultrasound as predictor of vaginal delivery in nulliparous women undergoing induction of labour and in their study they found postdatism as the commonest indication of induction [13,14].
The comparison of clinical vaginal examination findings showed significant differences among the three groups. Mean cervical effacement was highest in Group 1 (25.45±3.44%), followed by Group 2 (20.63±3.33%) and Group 3 (16.94±7.75%), with a statistically significant difference (p=0.001). Mean cervical dilatation was 1.90±0.84 cm, 1.50±0.81 cm, and 1.00±0.79 cm in Groups 1, 2, and 3, respectively; however, this difference was not statistically significant (p=0.077). The mean Bishop score was highest in Group 2 (3.16±0.83), compared with 2.92±0.85 in Group 1 and 2.92±0.80 in Group 3, showing a significant intergroup difference (p=0.005).
These findings highlight the importance of cervical assessment before induction. Bishop et al. established that cervical dilatation, effacement, consistency, position and fetal station collectively reflect cervical favourability and can help predict induction outcome. In a prospective study of nulliparous women, Vrouenraets et al. reported that an unfavourable Bishop score was associated with increased risk of caesarean delivery following induction [15]. Similarly, contemporary studies comparing ultrasound parameters with the Bishop score indicate that cervical length and fetal-head-related measurements may provide additional information for predicting successful induction. Thus, the significant differences in effacement and Bishop score in the present study support their relevance in assessing cervical readiness, while the nonsignificant difference in dilatation suggests that individual cervical parameters may not independently reflect overall cervical favourability [15][17].
The clinical vaginal examination findings demonstrated significant intergroup differences in cervical position and Bishop score. A posterior cervix was observed most frequently in Group 3 (71.7%), compared with 50.0% in Group 1 and 40.0% in Group 2, with a statistically significant difference (p=0.008). Mid-position cervix was more common in Group 2 (60.0%). Cervical consistency did not differ significantly (p=0.069), although a soft cervix predominated in Group 1 (50.0%). Head station was comparable across groups (p=0.829), with station −3 being the commonest finding. Bishop score distribution differed significantly (p=0.005), with score 3 predominating in Groups 3, 2, and 1 (48.3%, 45.0%, and 40.0%, respectively).
These findings highlight the significant role of cervical position and Bishop score in determining cervical readiness for labor induction. The Bishop scoring system evaluates factors such as cervical dilatation, effacement, consistency, position, and fetal station. Notably, Vrouenraets et al. found an unfavorable Bishop score correlates with a higher risk of cesarean deliveries in nulliparous women [15]. Similarly, Khandelwal et al. emphasized the importance of the Bishop score alongside ultrasound measurements in predicting labor induction outcomes [16]. The variability in cervical position and Bishop score observed in this study could influence the success of inductions and the mode of delivery.
The ultrasonographic assessment demonstrated significant differences among the three study groups in perineal head distance, cervical length, estimated fetal birth weight (EFBW), and fetal head position. Perineal head distance differed significantly (p<0.001), with 31–40 mm being predominant in Group 1 (70.0%), whereas 41–50 mm was more frequent in Groups 2 and 3 (45.0% and 53.3%). Cervical length also showed significant variation (p=0.001); 2.6–3.0 cm was most common in Groups 1 and 2, while cervical length >3 cm was considerably higher in Group 3 (35.0%). EFBW differed significantly (p=0.002), with estimated weight >3000 g more frequent in Group 3 (33.3%). AFI was comparable between groups (p=0.235). Fetal head position showed a significant difference (p=0.001), with occipito-anterior position predominant in Group 1 (90.0%), while non-occipito-anterior position was more common in Groups 2 and 3.
These findings indicate that transperineal and transvaginal ultrasound are effective in providing objective metrics related to fetal head descent and cervical readiness prior to induction. The study titled “Pre-induction translabial ultrasound measurements in predicting mode of delivery compared to Bishop score” reveals that ultrasound measurements, including cervical length and the distance from the fetal head to the pubic symphysis, have predictive power for determining the mode of delivery [18][20]. Furthermore, other studies highlight that using ultrasound-based scoring systems, which take into account cervical length, head-perineal distance, and fetal head position, can aid in forecasting the likelihood of a successful vaginal delivery [18]. Consequently, these findings advocate for the integration of ultrasonographic assessment as a complementary tool alongside traditional cervical examinations prior to induction.
The ROC analysis demonstrated that all three parameters—Bishop score, cervical length, and perineal head distance—were significant predictors of vaginal delivery. A Bishop score ≥4 showed an AUC of 0.764 (95% CI: 0.75–0.89), with 74.67% sensitivity and 69.9% specificity (p=0.001), indicating good discriminatory ability. Cervical length ≤2.5 cm had an AUC of 0.676 (95% CI: 0.592–0.759), with higher sensitivity (85.0%) and specificity of 70.0% (p=0.001). Perineal head distance ≤41.6 mm demonstrated the highest sensitivity (91.0%), with 67.4% specificity and an AUC of 0.688 (95% CI: 0.606–0.769) (p<0.001).
The findings are clinically valuable because they demonstrate that ultrasound-derived parameters can provide objective information before induction and may complement the conventional Bishop score. Bajpai et al., in “Manipal Cervical Scoring System by Transvaginal Ultrasound in Predicting Successful Labour Induction,” reported that ultrasound-based cervical assessment could help predict induction success [21][22]. Sarayo et al., in “The distance from maternal perineum to fetal head distance as a predictive of successful induction of labor,” similarly demonstrated the usefulness of fetal-head–perineal distance as a predictor of successful induction [23]. Eggebø et al. also showed that ultrasound assessment of fetal position provides clinically relevant information regarding delivery mode in nulliparous women [24].
Clinical value: The Bishop score had the highest AUC, suggesting the best overall discrimination in this dataset, whereas perineal head distance provided the highest sensitivity (91%). Cervical length also showed high sensitivity (85%). Therefore, combining conventional cervical assessment with ultrasound parameters may improve pre-induction counselling, identification of women likely to achieve vaginal delivery, and individualized induction planning. These parameters should, however, be considered adjunctive predictors rather than definitive tests, because mode of delivery is influenced by multiple maternal, cervical, fetal and intrapartum factors.
Strengths of the study include its focus on primigravida women, minimizing parity confounding, and the use of ROC analysis for determining ultrasound parameters alongside the Bishop score. Previous research supports the predictive value of ultrasound measurements for induction outcomes. Limitations involve small group sizes affecting statistical power and generalizability, variability in ultrasound measurements, and factors like maternal BMI influencing delivery outcomes. The study recommends larger multicenter research to validate the findings and assess combined ultrasound-Bishop models before clinical use.
Conclusion
The Bishop’s score, cervical length, and perineal head distance are effective in predicting labor outcomes post-induction. Their sensitivity and specificity rates are notable, with sensitivity values of 74.67%, 85.0%, and 91.0%, and specificity values of 69.9%, 70.0%, and 67.4%. Future research should explore the combination of these predictive factors. The study highlights the value of pre-induction ultrasonographic cervical assessments in forecasting delivery modes in primigravida women, suggesting that ultrasonography can complement clinical evaluations for improved counseling and delivery planning.
Declarations
Ethics approval
Ethical approval was obtained from the Institutional Ethics Committee.
Data Availability
All data are available from the corresponding author on reasonable request.
Competing Interests
No competing interests.
Funding Statement
None
Authors' contributions
All authors have equal contribution.
Acknowledgements
None