Introduction
Cardiovascular disease (CVD) is a chronic disease affecting the population and accounting for a very large proportion of deaths worldwide. It has been shown to be one of the leading causes of death, affecting over 500 million people globally [1]. CVD accounted for 20.5 million deaths in 2021. The British Heart Foundation has estimated that 7.4 million people are currently living in the UK with CVD, with 6.4 million in England alone [2].
Lipoprotein(a) [Lp(a)] is an LDL-like particle with an apolipoprotein(a) component covalently bound to apolipoprotein B-100. Elevated plasma Lp(a) is an independent, heritable risk factor for ASCVD, coronary heart disease, stroke, and calcific aortic valve disease [2]. Unlike conventional lipids, Lp(a) levels are minimally influenced by diet or lifestyle and remain largely genetically determined [4]. Furthermore, Lp(a) has been shown to be an independent factor in the stratification of CVD. The levels of Lp(a) are directly associated with the increased risk of cardiovascular disease progression.
Substantial ethnic variation exists: individuals of African ancestry exhibit two- to four-fold higher Lp(a) concentrations than those of European background, though the precise risk outcome correlation within each population varies [5][7]. In the United Kingdom, where population diversity continues to expand, with approximately 69.5 million residents as of mid-2025, there is increasing emphasis on equitable cardiovascular screening for ethnic minorities.
Despite expanding awareness, Lp(a) testing in the UK remains infrequent, limited primarily to specialist lipid services due to reliance on centralised immunoassay platforms. The emergence of validated POC testing, such as the iProtin® system (tstbio, UK), could enable decentralised quantitative assessment of Lp(a) in community settings, supporting the NHS cardiovascular disease prevention strategy [8]. The use of POCT devices could cut the time and resources needed to go to the central laboratory for testing. This process could get a better idea on the levels of Lp(a), prompting the individual to see a general practitioner, prompting a full lipid panel test. This use of the POCT is not really prevalent in the Black community, and the testing of these individuals could give an idea of the levels of Lp(a), which could lead to reflex testing, thereby limiting and reducing the morbidity and mortality associated with CVD.
This study aimed to measure Lp(a) concentrations among UK Black adults using samples obtained from a previous community-based cardiovascular screening programme. The iProtin® POC assay was used to categorise findings per HEART UK risk thresholds and determine the proportion of individuals with raised Lp(a) (> 125 nmol/L) compared with established UK reference data using the HEART UK criteria.
Materials and Methods
Study design
This is a retrospective analysis of samples. The sample size was determined by the availability of samples which were identified by race for this specific study and the outcomes aimed to be achieved.
Study setting
Samples were selected from specimens obtained at UK community cardiovascular screening activities between 2021 and 2023 in Colchester and Woolwich, United Kingdom.
Study population
Adults aged ≥18 and ≤70 years who self-identified as Black or Black-British on screening questionnaires, with no known cardiovascular disease or lipid disorders, were drawn from serum specimens stored from the Berkshire cardiovascular community screening programme. Participants had self-identified as Black or Black-British through questionnaires that were completed in the process of data collection.
Sample Size
There were a hundred eligible stored samples; however, there were 50 samples that had identifiers such as race, and 37 (male = 21; female = 16) used Cochran’s formula for estimating a proportion, applied with a finite population correction (FPC) since your sampling frame (N = 50) is small.
Sampling Technique & Device
The samples were selected using simple random selection of samples from the Black population due to race identifiers without exposing the other identifiers, such as names or unique identifiers.
The samples were analysed with the iProtin device and its cartridges that were provided by Connect2Pharma.
Inclusion criteria
-
Black or Black-British
-
Ages 18years and ≤ 70
-
Samples stored freezer and used solely for research.
Ethical Considerations
All specimens were anonymised; no identifying information was accessible. The protocol was reviewed according to the institutional human biological materials policy and deemed exempt from further ethics review due to the use of residual screening samples.
Statistical analysis
All analyses were performed using GraphPad Prism 11. The Shapiro–Wilk test was used to test the normality of continuous variables. The variables that did not follow a normal distribution were presented as medians and interquartile ranges. Furthermore, mean ± standard deviation was used for normally distributed variables. The independent-samples t-test is for normally distributed variables, while the Mann–Whitney U test is for non-normally distributed variables. Additionally, 95% confidence intervals for binomial proportions were calculated using the Wilson score method. Spearman's rank correlation coefficient (ρ) was used to compare Lp(a) to total cholesterol, LDL cholesterol, HDL cholesterol, triglycerides, and total cholesterol/HDL ratio. Statistical significance was set at p < 0.05.
Results
Thirty-seven samples were analysed for various parameters such as the lipid profile (total cholesterol, low density
| Variable | Group | Mean ± SD | IQR | p-valueᵃ |
| TC (mmol/L) | Total | 4.23 ± 0.88 | 4.24 (3.72–4.79) | 0.487 |
| Male | 4.32 ± 0.83 | 4.53 (3.75–4.79) | ||
| Female | 4.11 ± 0.96 | 4.00 (3.46–4.61) | ||
| LDL-C (mmol/L) | Total | 2.38 ± 0.89 | 2.15 (1.60–3.05) | 0.057 |
| Male | 2.62 ± 0.77 | 2.72 (1.94–3.08) | ||
| Female | 2.06 ± 0.96 | 1.63 (1.45–2.48) | ||
| HDL-C (mmol/L) | Total | 1.31 ± 0.41 | 1.27 (0.96–1.58) | 0.029 |
| Male | 1.18 ± 0.31 | 1.16 (0.93–1.47) | ||
| Female | 1.48 ± 0.47 | 1.55 (1.19–1.64) | ||
| Total cholesterol/HDL ratio | Total | 3.50 ± 1.19 | 3.20 (2.70–4.00) | 0.013 |
| Male | 3.84 ± 1.00 | 3.90 (3.10–4.80) | ||
| Female | 3.06 ± 1.31 | 2.95 (2.38–3.23) | ||
| Triglyceride (mmol/L) | Total | 1.24 ± 0.49 | 1.12 (0.96–1.41) | 0.806 |
| Male | 1.22 ± 0.51 | 1.11 (0.96–1.41) | ||
| Female | 1.27 ± 0.49 | 1.12 (0.95–1.39) |
Abbreviations: IQR, interquartile range; LDL, low-density lipoprotein; HDL, high-density lipoprotein; SD, standard deviation.
ᵃ p-value for male vs. Female comparison: independent-samples t-test for total cholesterol, LDL cholesterol, and HDL cholesterol (normally distributed, Shapiro–Wilk p > 0.05); Mann–Whitney U test for triglyceride and total cholesterol/HDL ratio (non-normally distributed, Shapiro–Wilk p < 0.05).
There were no potential confounders that could lead to bias, and the diagnostic criteria were established using the HEART UK criteria for Lp(a) classification. Lp(a) results were categorised according to HEART UK thresholds: normal < 32 nmol/L; minor 32–90 nmol/L; moderate 91–200 nmol/L; high 201–400 nmol/L; very high > 400 nmol/L. Lp(a) was compared against lipid parameters (total cholesterol, LDL, HDL, triglyceride, and total cholesterol/HDL ratio) (Table 2).
| Lp(a) vs. | Ρ | p-value |
| TC | 0.012 | 0.943 |
| LDL-C | −0.157 | 0.352 |
| HDL-C | 0.175 | 0.300 |
| TG | 0.095 | 0.576 |
| TC/HDL ratio | −0.161 | 0.341 |
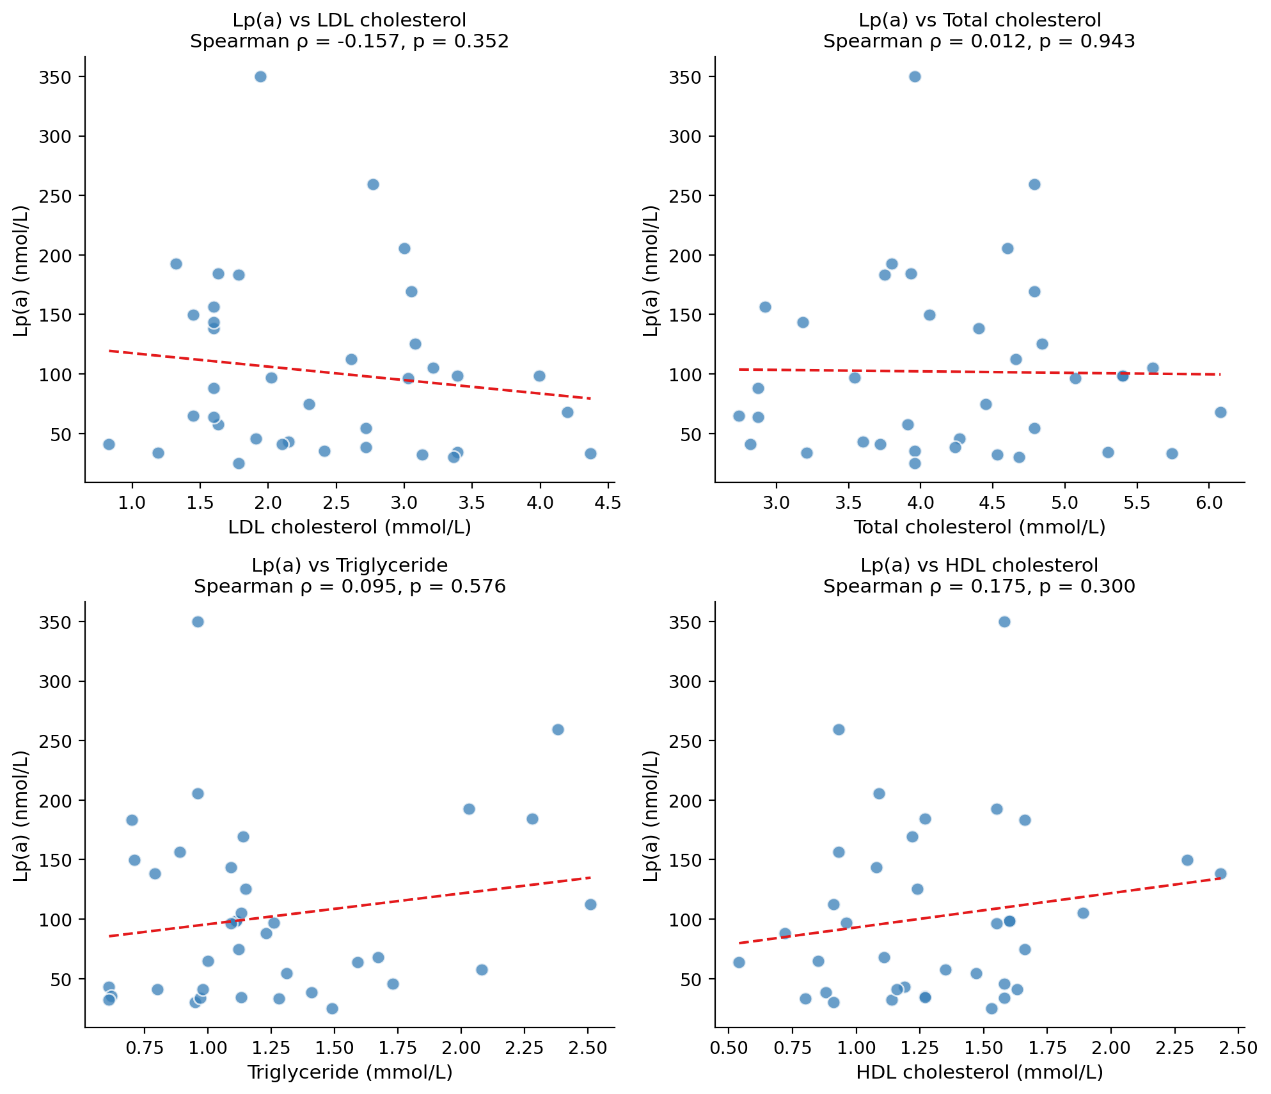
A significant correlation was found between Lp(a) and any conventional lipid parameter, consistent with Lp(a) being genetically determined and largely independent of the standard lipid profile (ρ-spearman).
Lp(a) was measured using the iProtin fluorescence-based POC analyser (tstbio, BMREDP0101, Taiwan). The device operates on an immunofluorescence sandwich principle, calibrated to WHO/IFCC standard materials. Following the manufacturer's protocol, 10μL of thawed serum was applied to a disposable test cartridge and read by the analyser after 7 minutes. Results were first expressed in mg/dL and then converted to nmol/L using the equation × 2.5 [9].
Across all three risk categories (optimal (<3.5), normal (3.5–5.0), and high risk (>5.0)), mean TC/HDL ratios (Table 3) were numerically similar to or higher in males than females in the optimal and normal groups, and the single female high-risk subject had a markedly higher ratio than the male high-risk group. Additionally, a greater proportion of the sample had an optimal TC/HDL ratio.
| Category | Male (n, mean±SD) | Female (n, mean±SD) | % |
| Optimal (<3.5) | 10, 2.97 ± 0.39 | 13, 2.60 ± 0.58 | 62.2 |
| Normal (3.5–5.0) | 6, 4.14 ± 0.35 | 2, 3.93 ± 0.34 | 21.6 |
| High risk (>5.0) | 5, 5.24 ± 0.15 | 1, 7.18 ± 0.00 | 16.2 |
The Lp(a) distribution by HEART UK showed that most of the population was in the minor category, and there were no samples with a very high Lp(a) concentration (Table 4). 12 (32.4%) samples were recorded with Lp(a) > 125 nmol/L, corresponding mainly to the moderate and high HEART UK categories, representing a third of the samples analysed.
| HEART UK category (nmol/L) | n (%) | 95% CI |
| Normal (<32) | 2(5.4) | 1.5–17.7 |
| Minor (32–90) | 17(46.0) | 31.0–61.6 |
| Moderate (91–200) | 15(40.5) | 26.3–56.5 |
| High (201–400) | 3(8.1) | 2.8–21.3 |
| Very high (>400) | 0(0.0) | 0.0–9.4 |
| Total | 37(100.0) | — |
| Lp(a) > 125 nmol/L | 12(32.4) | 19.6–48.5 |
The scatterplot of Lp(a) vs other lipid parameters TC, TG, HDL-C and LDL-C shows a weakly negative correlation with LDL and weakly positive correlations with TG and HDL, while there is no correlation with TC (Figure 1). There is no statistical significance in the comparisons of Lp(a) against TC (p=0.943), TG (p=0.576), HDL-C (p=0.300), and LDL-C (p=0.352). This is not an unexpected outcome, as it shows that the iProtin POCT device detects Lp(a) and shows discrimination against other lipid parameters as a form of an internal validation. Additionally, Lp(a) is genetically determined by the kringle IV-2 repeat polymorphism determined by the LPA gene. This further shows evidence that Lp(a) levels are independent of an excellent lipid profile, such as a high ρ and low LDL-C.
Discussion
The UK's growing, multi-ethnic population, estimated at approximately 69.9 million by 2026, scaling rapid Lp(a) assessment could materially impact risk stratification strategies. Elevated Lp(a) has been implicated in up to 20% of premature coronary events [10]. Within minority communities under-represented in lipid screening, POC assays could expand access, support on-site education, and enhance equity in early risk detection.
In this study, the iProtin® system demonstrated consistent operation using serum and offers operational simplicity, taking under 10 minutes per test. These features are advantageous for NHS Health Check programmes or mobile screening initiatives. Similar POC lipid analysers have previously demonstrated excellent accuracy (r² > 0.95) compared with laboratory analysers [11,12].
This study represents one of the first applications of the iProtin® POC assay to measure Lp(a) in a UK Black cohort. The median concentration (88 nmol/L) closely matches values reported in larger population studies of African-ancestry groups, reinforcing the biological trend toward higher baseline Lp(a) among these populations [3][4][6]. Notably, 12 (32.4%) of participants exceeded 125 nmol/L, a prevalence similar to reports from the UK Biobank and American multi-ethnic cohorts [5,7,10]. The UK Biobank analysis of 460,000 adults found median Lp(a) levels of 89 nmol/L in Black participants and 32 nmol/L in White participants, with elevated (>125 nmol/L) concentrations in approximately 23% of the full cohort [5].
This study showed that only 2 (5.4%) fell within the normal range (<32 nmol/L); nearly half of these participants were within the minor risk 17 (46%), moderate risk 15 (40.5%) and high risk 3 (8.1%). This put the total of 94.6% of participants exceeding the normal threshold for HEART UK.
The Women's Health Study and ARIC cohorts also demonstrated 2- to 3-fold higher Lp(a) distributions in African-American individuals [7,10]. Our study's ethnic-specific median thus aligns precisely with these data. Furthermore, the HDL-C and TC/HDL-C ratios were statistically significant (HDL-C male vs female (1.18 ± 0.3 vs 1.48 ± 0.47); p = 0.029 and TC/HDL-C male vs female (3.84 ± 1.00 vs 3.06 ± 1.31); p = 0.013). This also shows that the levels of elevated Lp(a) are independent of normal values of lipid profiles.
Across the general UK population, average Lp(a) concentrations are closer to 35–40 nmol/L; there are ethnic-specific values for white, Asian and Black which are 19 nmol/L, 31 nmol/L and 75 nmol/L respectively. Thus, the 88 nmol/L median observed in this study roughly doubles that of national averages, emphasising the need for ethnicity-specific interpretation of risk thresholds [13,14].
Ethnic variability in Lp(a) is primarily driven by heterogeneity in the LPA gene kringle IV-2 repeat polymorphism. Individuals of African ancestry often possess shorter apo(a) isoforms that yield higher particle concentrations [15]. Mendelian randomisation studies indicate that, despite differences in distribution, elevated Lp(a) confers proportional ASCVD risk per unit increase across ethnicities [16].
Our findings corroborate the growing recognition that approximately one in five UK adults and potentially a higher proportion among those of African ancestry harbour elevated Lp(a) [9]. Collectively, studies from the UK Biobank, Copenhagen cohorts, and ARIC study converge on the conclusion that Lp(a) contributes independently to global cardiovascular risk [5,7,9,14]. The challenge lies not only in identifying affected individuals but also in translating this knowledge into preventive interventions and individualised precision medicine. Novel POC assays such as iProtin® offer a route to democratising access to such information.
Limitations
This study has several limitations, such as the small sample size, which could limit statistical inferences. Additionally, the population was made homogeneously of Black participants. Furthermore, this was a cross-sectional design study that showed a snapshot of the population at the time. Due to time constraints, there was no detailed clinical data such as associated cardiovascular history and current medications. This study demonstrated the feasibility of Lp(a) measurement with the prediction of future cardiovascular outcomes. All samples were stored sera rather than fresh capillary specimens, and no paired laboratory validation was conducted. Nonetheless, the median and distribution patterns align well with published reference data, suggesting biological plausibility of the measured values.
Future Directions
Larger comparative studies using paired reference laboratory assays should verify iProtin® performance and analytical bias. Future research might incorporate simultaneous genotyping for LPA variants to clarify genetic influences and evaluate the cost-effectiveness of Lp(a) POC screening in UK community health settings. Linking POC results to cardiovascular outcomes would ultimately determine clinical benefit.
Conclusion
In this exploratory study of UK Black community participants, median Lp(a) concentration measured using the iProtin® POC system was 88 nmol/L, with 22.5% of individuals above the 125 nmol/L threshold linked to elevated cardiovascular risk. These findings mirror patterns seen in larger population-based cohorts and confirm that higher Lp(a) levels are typical within African-ancestry groups.
The iProtin® assay demonstrated practicality and reproducibility in a community context, supporting its potential to complement conventional laboratory services. Broader validation and longitudinal research are required, but integration of reliable POC measurement could significantly enhance early detection and cardiovascular risk stratification in under-served populations.
Abbreviations
apo(a): Apolipoprotein(a)
ApoB-100: Apolipoprotein B-100
ARIC: Atherosclerosis Risk in Communities
ASCVD: Atherosclerotic Cardiovascular Disease
BHF: British Heart Foundation
CI: Confidence Interval
CVD: Cardiovascular Disease
FPC: Finite Population Correction
HDL: High-Density Lipoprotein
HDL-C: High-Density Lipoprotein Cholesterol
HEART UK: Heart UK (UK Cholesterol Charity)
IFCC: International Federation of Clinical Chemistry and Laboratory Medicine
IQR: Interquartile Range
LDL: Low-Density Lipoprotein
LDL-C: Low-Density Lipoprotein Cholesterol
LPA: Lipoprotein(a) gene
Lp(a): Lipoprotein(a)
NHS: National Health Service
POC: Point-of-Care
POCT: Point-of-Care Testing
SD: Standard Deviation
TC: Total Cholesterol
TG: Triglycerides
WHO: World Health Organization
ρ (rho): Spearman’s Rank Correlation Coefficient
Declarations
Author Contributions
Conceptualisation (TG, JB, AA, AO), literature search (TG, JB), methodology (TG, JB, AA, AO), project administration (TG, JB, AA, AO), and supervision (TG, JB) Writing – original draft (TG, JB); writing – review and editing (TG, JB, AA, AO).
Data availability
Datasets that were generated or analysed during the current study are available.
Clinical trial registration
Clinical trial number: not applicable. Registration date: not applicable.
Funding
Connet2Pharma UK Limited supplied the iProtin device and cartridges for this study.
Informed Consent Statement
Not Applicable.
Disclosure
No disclosure
Use of AI-assisted tools
AI-assisted tools were used only to support language polishing, formatting, and organisation. The authors critically reviewed, verified, and approved all content, references, interpretations, and conclusions and took full responsibility for the final manuscript.