Introduction
Early glycaemic control after the diagnosis of type 2 diabetes is associated with lower long-term risk of diabetes-related complications, making accurate assessment of presenting glycaemic severity clinically important [1][2]. Contemporary recommendations emphasise person-centred treatment: glucose-lowering therapy should have sufficient efficacy to achieve an individualised glycaemic goal, while cardiovascular and kidney disease, weight goals, hypoglycaemia risk, adverse effects, treatment burden, cost, access, and patient preferences also influence treatment choice [3][4]. Initial combination therapy may be appropriate when greater glucose-lowering efficacy is required, and insulin should be considered when hyperglycaemia is very high or accompanied by symptoms or catabolic features [3].
BMI is also important in diabetes care, but it answers a different clinical question. It provides a simple anthropometric description of body habitus and contributes to assessment of adiposity and weight-related risk. It may influence the desirability of weight-lowering, weight-neutral, or weight-promoting glucose-lowering agents. BMI does not, however, directly measure current glycaemic exposure, duration of undetected hyperglycaemia, insulin secretory reserve, or the degree of beta-cell failure. This distinction may be particularly relevant in South Asian populations, in whom type 2 diabetes frequently occurs at lower BMI [5][17] and impaired insulin secretory capacity may contribute substantially to dysglycaemia [6][7].
In clinical practice, visible phenotype may nevertheless shape an early impression of disease severity before laboratory results are reviewed. The relevant question is therefore operational: does crossing a familiar BMI threshold change the probability that a newly diagnosed patient has marked hyperglycaemia by enough to be clinically informative? This is a threshold-discrimination question rather than an association question. A useful threshold should meaningfully alter post-test probability; if marked hyperglycaemia is equally common on both sides of the cut-point, the threshold has little triage value even before any formal association analysis is considered.
The present secondary analysis was designed around that operational question. The primary objective was to quantify the performance of BMI ≥25.0 kg/m² for identifying marked hyperglycaemia, defined a priori as HbA1c ≥9.0%, in treatment-naive adults with newly diagnosed type 2 diabetes. Secondary objectives were to examine the very-high-glycaemia threshold of HbA1c ≥10.0% and to quantify discordance between BMI ≥25.0 kg/m² and a pre-specified HbA1c ≥7.5% operational decision boundary. The latter is used only to illustrate classification discordance and should not be interpreted as a universal prescription rule; current guidance requires treatment individualisation [3][4].
Patients and Methods
Study design, setting, and source population
This was a pre-specified secondary analysis of baseline data from a randomised controlled trial conducted by the Department of Pharmacology in collaboration with the Department of General Medicine at Rama Medical College Hospital and Research Centre, Kanpur, Uttar Pradesh (CTRI/2024/10/074542). Consecutive adults attending diabetes and general medicine outpatient services over 12 months were screened. The present report follows STROBE principles for observational analyses of baseline data [8].
The parent study was approved by the Institutional Ethics Committee, conducted in accordance with the Declaration of Helsinki [9] and Indian Council of Medical Research ethical guidance [10], and all participants provided written informed consent.
Participants
Adults aged 18 years or older with type 2 diabetes diagnosed within the preceding four weeks and no previous exposure to glucose-lowering medication were eligible. Exclusion criteria were type 1 diabetes, secondary or monogenic diabetes, gestational diabetes, pregnancy or lactation, diabetic ketoacidosis or hyperosmolar crisis, malignancy, chronic liver disease, advanced kidney disease, conditions expected to invalidate HbA1c interpretation (including anaemia, recent transfusion, haemoglobinopathy, haemolysis, or erythropoietin therapy), and systemic corticosteroid or other medication use with major effects on glucose metabolism. Complete anthropometric and HbA1c data were available for 410 participants, who formed the analysis set.
Measurements
Weight was measured to the nearest 0.1 kg on a calibrated digital platform scale with participants in light clothing and without footwear. Height was measured to the nearest 0.1 cm using a stadiometer with the head in the Frankfort horizontal plane. Measurements were taken twice and averaged, with a third measurement when the first two differed by more than 0.5 kg or 0.5 cm. BMI was calculated as weight in kilograms divided by height in metres squared. Venous blood for HbA1c was obtained before the first glucose-lowering prescription. HbA1c was measured using an NGSP-certified, IFCC-traceable analyser under internal and external quality control.
Prespecified glycaemic and anthropometric thresholds
For descriptive analysis, presenting HbA1c was grouped into four pre-specified strata: <7.5%, 7.5-8.9%, 9.0-9.9%, and ≥10.0%. These categories were chosen to separate lower, moderate, marked, and very high glycaemic exposure while retaining the clinically important ≥10.0% threshold at which insulin consideration becomes more prominent, particularly in the presence of symptoms or catabolic features [3]. The strata are analytical categories and should not be interpreted as a rigid drug-count algorithm.
BMI ≥25.0 kg/m² was the primary anthropometric threshold because it corresponds to the conventional international definition of overweight [11]. BMI classes were also described using <18.5, 18.5-24.9, 25.0-29.9, 30.0-34.9, and ≥35.0 kg/m². Asian-specific action points are clinically relevant in India [11][12], but the main discrimination analysis deliberately used a single, widely recognised threshold to avoid multiple-cut-point testing.
Threshold-performance and discordance analyses
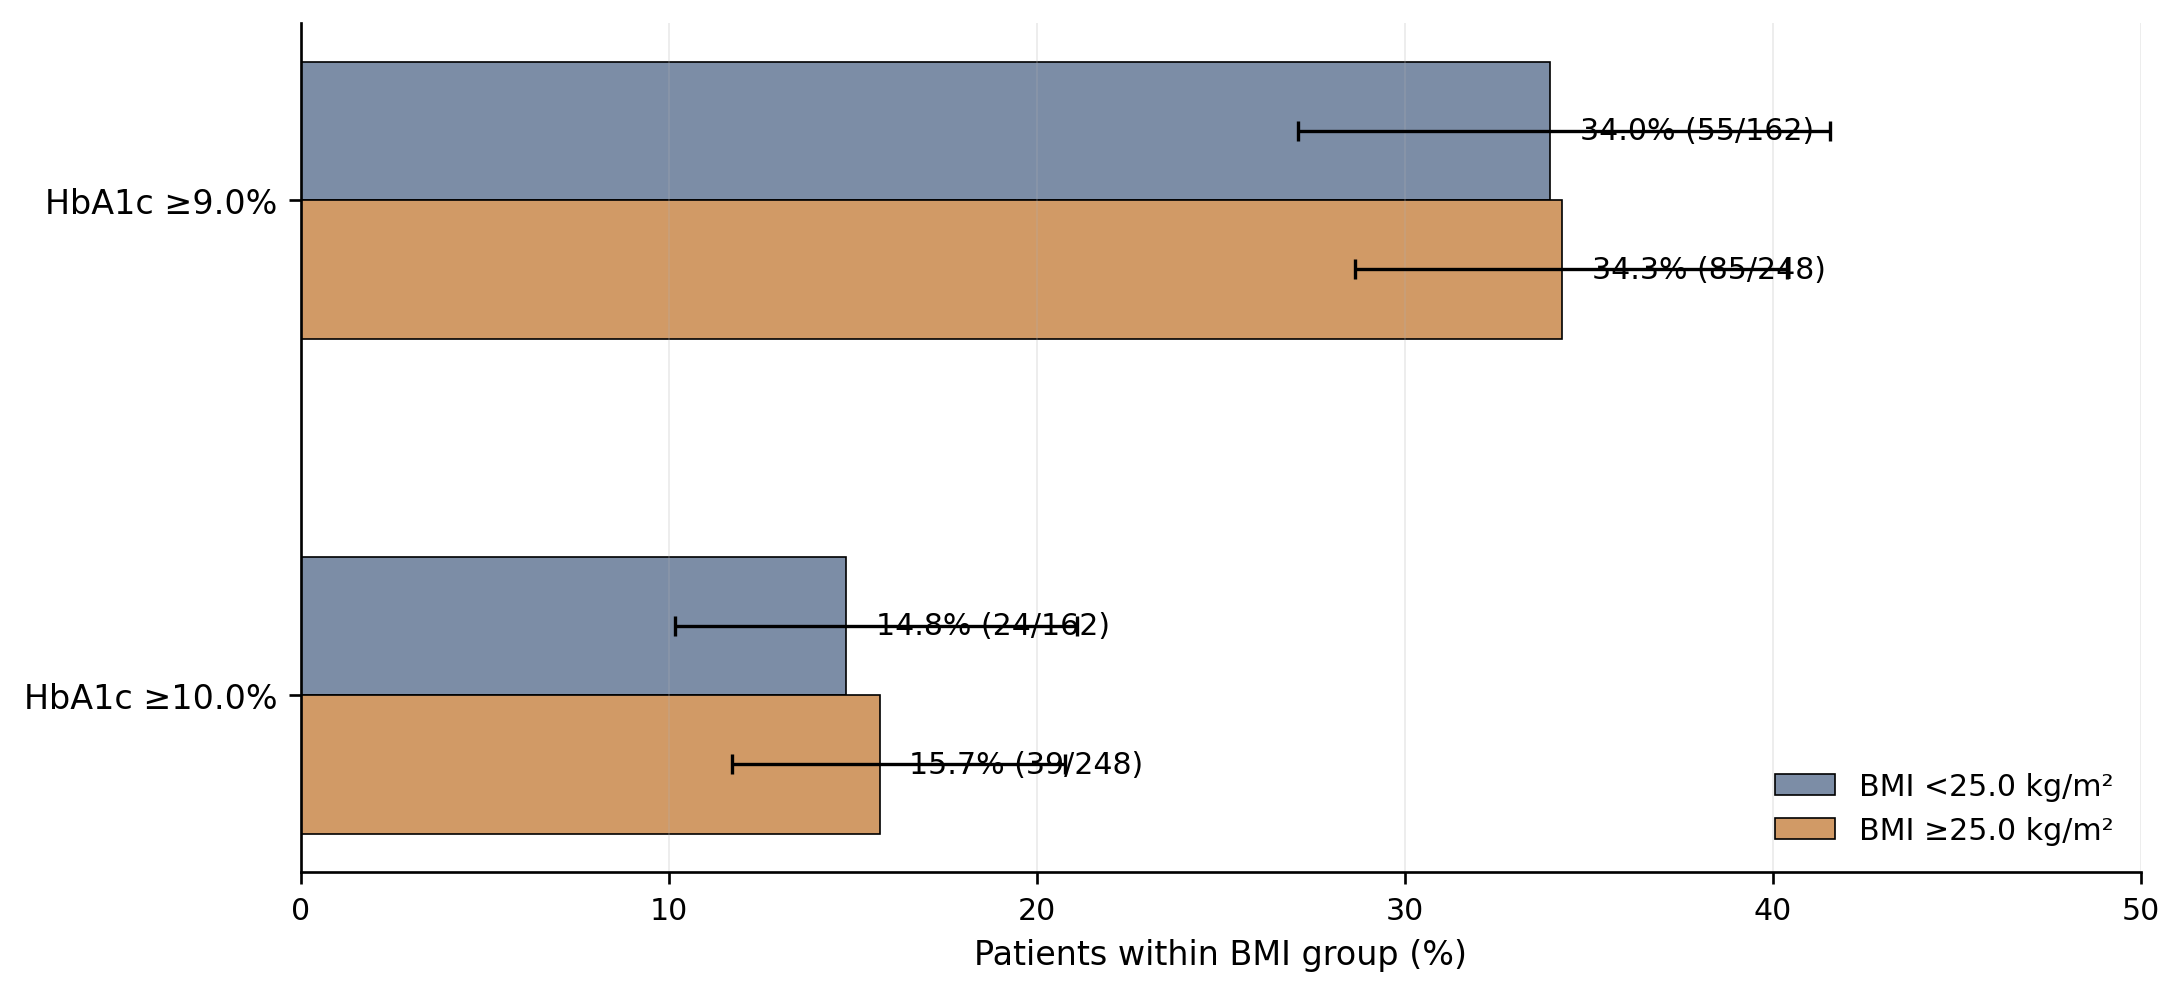
The primary outcome was marked hyperglycaemia, defined as HbA1c ≥9.0%. BMI ≥25.0 kg/m² was treated as an index classification threshold rather than as a diagnostic test for diabetes. From the observed 2 x 2 table, we calculated sensitivity, specificity, positive predictive value (PPV), negative predictive value (NPV), positive and negative likelihood ratios, and overall accuracy. Wilson score 95% confidence intervals were calculated for sensitivity and specificity [13]. Because predictive values are prevalence-dependent, the observed prevalence of HbA1c ≥9.0% and ≥10.0% was also calculated separately in the BMI <25.0 and BMI ≥25.0 kg/m² groups. These conditional prevalences are presented as grouped horizontal bars with 95% Wilson confidence intervals in Figure 1. Likelihood ratios were used to quantify how much crossing the BMI threshold changed the odds of the HbA1c outcome [14].
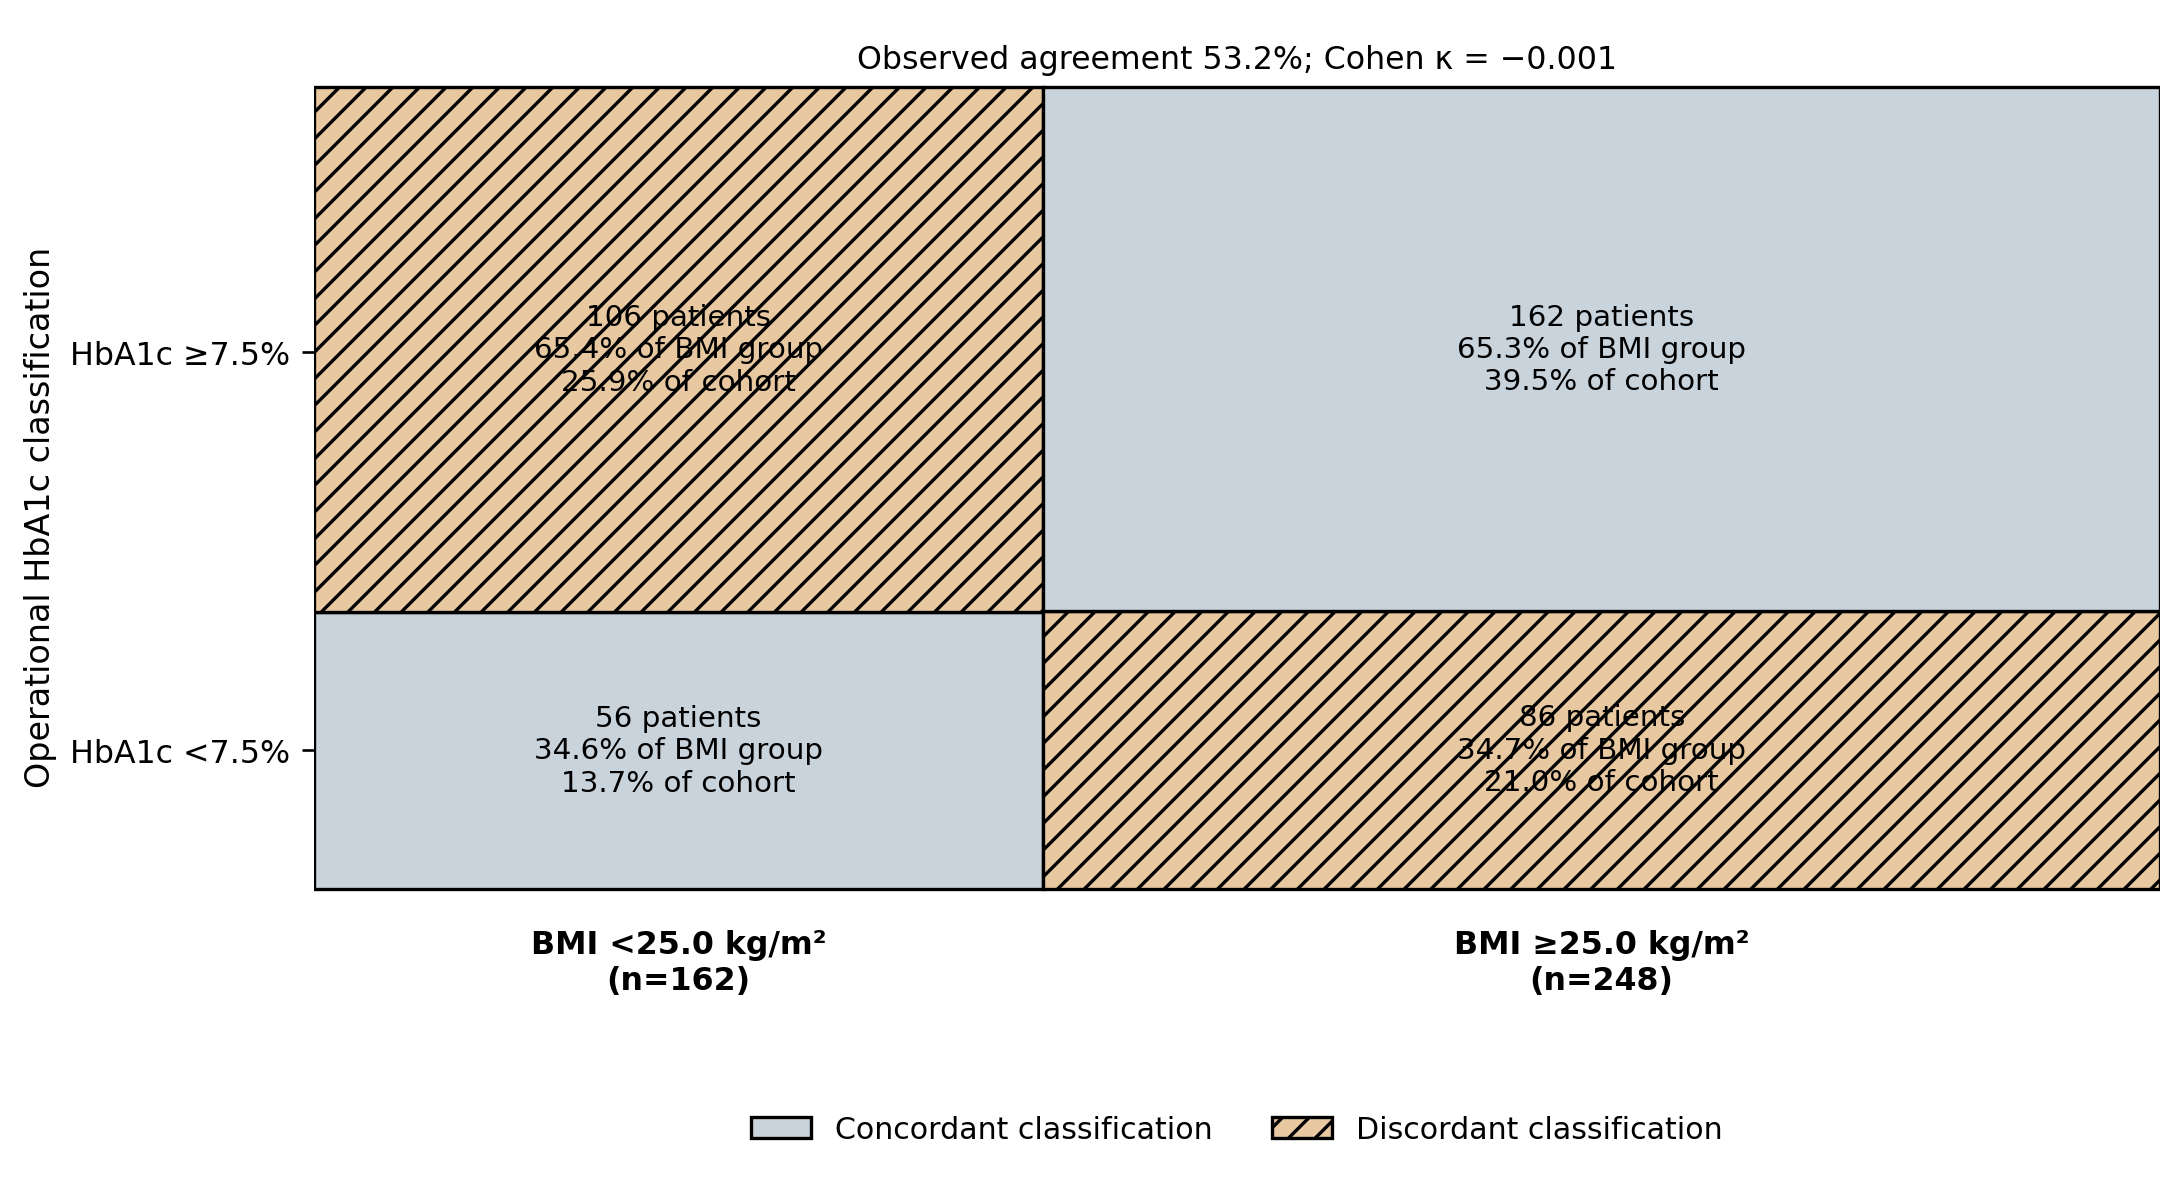
Two secondary analyses were pre-specified. First, the same threshold-performance measures were calculated for HbA1c ≥10.0%, representing very high glycaemic exposure. Second, HbA1c ≥7.5% was used as an operational decision boundary to illustrate how often a BMI ≥25.0 kg/m² gate would classify patients differently from an HbA1c-based boundary. This comparison is intentionally hypothetical and does not model actual prescribing behaviour. Observed agreement and Cohen's kappa were calculated [15]. Agreement was interpreted using the Landis–Koch benchmarks [16]. Figure 2 displays the four resulting cells as an area-proportional mosaic, so both the size of the BMI groups and the concordant/discordant fractions remain visible. A sensitivity analysis repeated this illustrative comparison using BMI ≥30.0 kg/m².
All analyses were two-sided and descriptive inferential estimates are reported with 95% confidence intervals where appropriate. No imputation was required because the analysis set was complete. Calculations were performed in Python 3.
Separation from the companion association analysis
A companion analysis of the same baseline cohort addresses a different question: whether BMI category and HbA1c category are statistically associated and whether the variables correlate on their original scales. Those association analyses are not repeated here. The present report is restricted to the clinical performance of pre-specified BMI thresholds for identifying pre-specified HbA1c states and to the resulting classification discordance. Accordingly, the principal measures are conditional prevalence, predictive values, likelihood ratios, and agreement rather than association p values or continuous-marker correlation.
Results
Distribution of presenting HbA1c and BMI
Among 410 treatment-naive adults, 142 (34.6%) had HbA1c <7.5%, 128 (31.2%) had HbA1c 7.5-8.9%, 77 (18.8%) had HbA1c 9.0-9.9%, and 63 (15.4%) had HbA1c ≥10.0% (Table 1). Thus, 140 participants (34.1%) had marked hyperglycaemia at HbA1c ≥9.0%. Median HbA1c increased from 6.7% in the lowest stratum to 10.7% in the highest stratum. Median BMI, in contrast, did not show a corresponding monotonic pattern.
The proportion with BMI <25.0 kg/m² was 39.4%, 39.8%, 40.3%, and 38.1% across the four HbA1c strata, respectively. The near-constant proportion is the central descriptive finding: lower BMI was common at every level of presenting glycaemia, including the highest HbA1c stratum. When the cohort was dichotomised at BMI 25.0 kg/m², HbA1c ≥9.0% was present in 55 of 162 participants (34.0%) below the BMI threshold and 85 of 248 (34.3%) at or above it. For HbA1c ≥10.0%, the corresponding prevalences were 14.8% (24/162) and 15.7% (39/248). The grouped prevalence comparison in Figure 1 makes the minimal separation visually explicit: crossing the conventional overweight threshold changed the absolute prevalence of marked or very high hyperglycaemia by less than one percentage point.
| HbA1c stratum | n (%) | Median HbA1c % (IQR) | Mean HbA1c % ± SD | Median BMI kg/m² (IQR) | Mean BMI ± SD | BMI <25 n (%) | BMI ≥ 30 n (%) |
| <7.5% | 142 (34.6) | 6.7 (6.3-7.0) | 6.65 ± 0.48 | 26.7 (22.9-30.6) | 26.9 ± 5.3 | 56 (39.4) | 42 (29.6) |
| 7.5-8.9% | 128 (31.2) | 8.1 (7.8-8.6) | 8.18 ± 0.44 | 26.4 (23.2-30.7) | 26.8 ± 5.3 | 51 (39.8) | 38 (29.7) |
| 9.0-9.9% | 77 (18.8) | 9.3 (9.1-9.6) | 9.38 ± 0.30 | 25.8 (22.5-28.9) | 25.9 ± 5.0 | 31 (40.3) | 19 (24.7) |
| ≥10.0% | 63 (15.4) | 10.7 (10.1-12.0) | 11.17 ± 1.23 | 28.4 (22.4-32.6) | 27.7 ± 6.6 | 24 (38.1) | 27 (42.9) |
| All participants | 410 (100) | - | - | - | - | 162 (39.5) | 126 (30.7) |
Note: Percentages in the final two columns are within HbA1c stratum. BMI, body mass index; IQR, interquartile range; SD, standard deviation.
Primary threshold-performance analysis: BMI ≥25.0 kg/m² and HbA1c ≥9.0%
Of the 140 participants with HbA1c ≥9.0%, 85 had BMI ≥25.0 kg/m² and 55 had BMI <25.0 kg/m². Among the 270 with HbA1c <9.0%, 163 had BMI ≥25.0 kg/m² and 107 had BMI <25.0 kg/m². BMI ≥25.0 kg/m² therefore had a sensitivity of 60.7% (95% CI 52.4-68.4) and specificity of 39.6% (95% CI 34.0-45.6) for marked hyperglycaemia. PPV was 34.3%, NPV 66.0%, the positive likelihood ratio was 1.01, and the negative likelihood ratio was 0.99 (Table 2). The PPV was almost identical to the cohort prevalence of HbA1c ≥9.0% (34.1%), and both likelihood ratios were essentially 1. Crossing BMI 25.0 kg/m² therefore produced virtually no probability enrichment for marked hyperglycaemia.
Secondary severity and decision-discordance analyses
For HbA1c ≥10.0%, 39 of 63 participants had BMI ≥25.0 kg/m² and 24 (38.1%) had BMI <25.0 kg/m². BMI ≥25.0 kg/m² again provided little probability separation: sensitivity was 61.9% (95% CI 49.6-72.9), specificity 39.8% (95% CI 34.8-45.0), PPV 15.7%, NPV 85.2%, positive likelihood ratio 1.03, and negative likelihood ratio 0.96 (Table 2). The PPV of 15.7% was almost identical to the overall prevalence of HbA1c ≥10.0% (15.4%). Consistently, the absolute prevalence difference between the two BMI groups was only 0.9 percentage points (14.8% vs 15.7%), with substantially overlapping 95% confidence intervals (Figure 1).
| HbA1c outcome | Sensitivity % (95% CI) | Specificity % (95% CI) | PPV % | NPV % | LR+ | LR- |
| ≥7.5% (operational) | 60.4 (54.5-66.1) | 39.4 (31.8-47.7) | 65.3 | 34.6 | 1.00 | 1.00 |
| ≥9.0% (primary) | 60.7 (52.4-68.4) | 39.6 (34.0-45.6) | 34.3 | 66.0 | 1.01 | 0.99 |
| ≥10.0% (secondary) | 61.9 (49.6-72.9) | 39.8 (34.8-45.0) | 15.7 | 85.2 | 1.03 | 0.96 |
Note: BMI threshold fixed at 25.0 kg/m². CI, confidence interval; LR+, positive likelihood ratio; LR-, negative likelihood ratio; NPV, negative predictive value; PPV, positive predictive value.
For the illustrative HbA1c ≥7.5% decision boundary, 268 participants were above the HbA1c threshold. Of these, 106 (39.6%) had BMI <25.0 kg/m² and would fall below a BMI ≥25.0 kg/m² gate. Conversely, among 142 participants with HbA1c <7.5%, 86 (60.6%) had BMI ≥25.0 kg/m² and would fall above the BMI gate. The HbA1c boundary was met by 65.4% (106/162) of participants with BMI <25.0 kg/m² and 65.3% (162/248) of those with BMI ≥25.0 kg/m². As shown by the area-proportional mosaic in Figure 2, the two classifications agreed in 218 of 410 patients (53.2%), with Cohen's kappa −0.001 [16], while the two discordant cells together contained 192 patients. Raising the BMI gate to 30.0 kg/m² reduced the proportion selected but increased the number above the HbA1c boundary who fell below the BMI gate to 184 of 268 (68.7%); overall agreement was 44.9% and kappa 0.014. These figures describe hypothetical classification discordance, not observed undertreatment or overtreatment.
Discussion
Principal findings
In this cohort of 410 treatment-naive adults with newly diagnosed type 2 diabetes, crossing BMI 25.0 kg/m² scarcely changed the probability of marked presenting hyperglycaemia. Approximately 40% of patients were below BMI 25.0 kg/m² in every HbA1c stratum, including among those with HbA1c ≥10.0%. More importantly, the conditional prevalence of HbA1c ≥9.0% was 34.0% below the BMI threshold and 34.3% at or above it; for HbA1c ≥10.0%, the corresponding values were 14.8% and 15.7%. Figure 1 shows that these paired estimates and their confidence intervals are almost superimposable. The likelihood ratios close to 1 and the near-equality of PPV with baseline prevalence express the same result in clinically interpretable terms: knowing whether a patient crossed the conventional overweight threshold added almost no information about whether presenting HbA1c crossed the marked or very-high-glycaemia thresholds.
The illustrative decision-boundary analysis reached the same operational conclusion. At HbA1c ≥7.5%, the proportion meeting the HbA1c criterion was virtually identical in the BMI <25.0 and BMI ≥25.0 kg/m² groups (65.4% and 65.3%). The area-proportional mosaic in Figure 2 shows why the BMI gate produced no useful agreement: both BMI columns contain nearly the same glycaemic composition, leaving large discordant regions despite different group sizes. A BMI ≥25.0 kg/m² gate therefore disagreed with the HbA1c classification in nearly half the cohort and produced no agreement beyond chance [16]. These are hypothetical classification differences rather than observed prescribing errors. The analysis does not imply that HbA1c alone determines a complete treatment regimen; it shows only that BMI is not informative enough to stand in for measured glycaemia when estimating presenting biochemical severity.
What the threshold-performance analysis adds
The companion association analysis asks whether BMI and HbA1c distributions differ statistically across the cohort. The present analysis asks a different, individual-level question: does a specific BMI cut-point change the probability of crossing a clinically relevant HbA1c threshold enough to be useful for triage? These questions are related but not interchangeable. A p value or correlation coefficient does not show how much a positive classification changes post-test probability. Here, PPVs that remain essentially equal to outcome prevalence and likelihood ratios clustered around 1 provide the directly interpretable result: crossing BMI 25.0 kg/m² neither enriched nor meaningfully depleted the probability of marked hyperglycaemia. That operational finding is the principal contribution of this report.
Interpretation and clinical relevance
The result is physiologically plausible. BMI is an indirect measure of body mass relative to height and does not distinguish fat from lean mass, locate visceral or hepatic fat, quantify insulin resistance, measure beta-cell secretory reserve, or indicate the duration of undetected hyperglycaemia. These determinants can differ substantially between patients with similar BMI. In South Asian populations, type 2 diabetes may develop at lower BMI and beta-cell dysfunction can be prominent, so a normal-weight phenotype does not imply mild glycaemic disease [5][7][17]. The observation that more than one-third of patients with HbA1c ≥10.0% were below BMI 25.0 kg/m² is compatible with this clinical heterogeneity.
The practical implication is not that BMI is unimportant, but that BMI and HbA1c answer different clinical questions. HbA1c describes recent glycaemic exposure and helps quantify the magnitude of glucose lowering that may be required, whereas BMI contributes to assessment of adiposity, weight-related risk, and the desirability of weight-lowering, weight-neutral, or weight-promoting therapies. Contemporary treatment additionally incorporates cardiovascular and kidney disease, hypoglycaemia risk, adverse effects, cost, treatment burden, access, and patient preferences [3][4]. Phenotype assessment and glycaemic-severity assessment should therefore be separated: body habitus may shape therapeutic selection, but should not be used to infer biochemical severity.
This interpretation also avoids treating HbA1c cut-points as rigid prescribing rules. Current ADA guidance supports initial combination therapy when greater glucose-lowering efficacy is needed and recommends considering insulin when HbA1c or blood glucose is very high, or when symptoms or catabolic features are present [3]. The present study was not designed to compare specific drug regimens and does not claim that a fixed HbA1c value determines a fixed number of medications. Its narrower conclusion is that the conventional BMI threshold provided negligible incremental information about whether presenting glycaemia was markedly elevated.
Implications for clinical assessment and future research
At the first clinical assessment, a lean phenotype should not reduce the urgency of establishing glycaemic severity. A patient with normal or low BMI may still have marked hyperglycaemia and warrants the same systematic assessment of HbA1c or plasma glucose, symptoms, catabolic features, comorbidity, and treatment urgency as a heavier patient. Conversely, excess adiposity should not be assumed to imply severe presenting hyperglycaemia when biochemical measurements are not yet available. This separation is especially relevant in settings where visual phenotype may influence the initial clinical impression before laboratory results are reviewed.
Future work should test whether markers that capture metabolic phenotype more directly than BMI can improve severity stratification at diagnosis. Multicentre studies could evaluate waist circumference or waist-to-height ratio [12], body-composition measures, C-peptide, and islet autoantibodies alongside HbA1c, and should include community-detected as well as tertiary-care populations. External validation should also examine whether alternative anthropometric thresholds materially change post-test probability. Such studies would determine whether the limited discrimination observed here is specific to BMI or reflects a broader limitation of anthropometry as a surrogate for presenting glycaemic severity.
Strengths and limitations
Strengths include the exclusively treatment-naive population, which avoids distortion of presenting HbA1c by previous glucose-lowering therapy; consecutive recruitment; standardised anthropometry; and HbA1c measurement before the first prescription. The analysis uses pre-specified, clinically recognisable thresholds and reports the underlying patient counts together with predictive values and likelihood ratios, allowing the degree of probability change to be assessed directly rather than inferred from a significance test.
Several limitations should temper interpretation. First, this was a single-centre tertiary-care cohort, so the distribution of HbA1c may differ from community-detected diabetes and the findings require external validation. Second, BMI does not measure visceral adiposity, hepatic fat, body composition, or sarcopenia [11][12]; other anthropometric or imaging markers may perform differently. Third, C-peptide and islet autoantibodies were not measured, so latent autoimmune diabetes or other insulin-deficient phenotypes could not be identified among lean participants with severe hyperglycaemia [18]. Fourth, the BMI ≥25.0 kg/m² cut-point was selected for clinical familiarity rather than because it was optimised in this dataset; alternative thresholds could perform differently, although a data-derived optimum would require independent validation. Fifth, the HbA1c ≥7.5% decision boundary is an operational analytic simplification, and clinicians do not generally use a BMI-only treatment rule; the discordance analysis therefore represents hypothetical classification differences, not actual treatment errors. Finally, the same baseline cohort is also used in a companion association analysis. The present study should not be interpreted as independent replication; its contribution is the distinct threshold-performance question and the quantification of post-test probability and classification discordance.
Conclusion
In treatment-naive adults with newly diagnosed type 2 diabetes at a tertiary centre in north India, the conventional BMI threshold of 25.0 kg/m² provided negligible discrimination for marked presenting hyperglycaemia. The prevalence of HbA1c ≥9.0% was essentially unchanged below and above the threshold (34.0% vs 34.3%), as was the prevalence of HbA1c ≥10.0% (14.8% vs 15.7%), and likelihood ratios remained close to 1. These findings do not diminish the importance of BMI for adiposity and weight-related risk. They indicate, instead, that body habitus should not be used to triage or infer biochemical severity at diagnosis. Presenting glycaemia should be established from HbA1c and/or plasma glucose and interpreted together with symptoms, catabolic features, comorbidities, and patient-specific treatment considerations. BMI should remain part of person-centred assessment and therapeutic selection, but not a substitute for measured glycaemic severity.
Declarations
Ethics approval and consent to participate
The parent trial was approved by the Institutional Ethics Committee of Rama Medical College Hospital and Research Centre, Kanpur, and registered with the Clinical Trials Registry - India (CTRI/2024/10/074542). All participants provided written informed consent, including consent for secondary analysis of baseline data.
Consent for publication
Not applicable; no individually identifiable information is presented.
Availability of data and materials
The de-identified baseline dataset and analysis code are available from the corresponding author on reasonable request, subject to institutional and ethical requirements.
Competing interests
The authors declare that they have no competing interests.
Funding
No external funding was received. The work was supported by departmental resources.
Authors' contributions
Conception and design, acquisition of data, statistical analysis, and drafting of the manuscript were led by the first author. Supervision, methodological guidance, and critical revision were provided by the second and third authors. Clinical case identification, verification of diagnostic and treatment-naive status, and revision for clinical accuracy were provided by the fourth author. All authors read and approved the final manuscript and agree to be accountable for its content.
Acknowledgements
The authors thank the nursing and laboratory staff of the outpatient and biochemistry services for measurement standardisation and quality control, and the participants for their time.
Article Type
Original Research - secondary threshold-performance analysis of baseline data from a registered randomised controlled trial
Trial registration: CTRI/2024/10/074542