Introduction
Type 2 diabetes mellitus (T2DM) has emerged as a significant public health problem worldwide, with concern, and is a major contributor to cardiovascular morbidity and mortality. Chronic hyperglycemia in T2DM drives a wide spectrum of microvascular and macrovascular complications through mechanisms involving endothelial dysfunction, increased oxidative stress, autonomic imbalance, and adverse cardiac remodeling [1]. As the leading cause of death in people with diabetes, cardiovascular disease [2], underscores the need for early identification of subclinical risk factors. As the leading cause of death in people with diabetes, cardiovascular disease underscores the need for timely identification of subclinical risk factors.
Defined by a urinary albumin-to-creatinine ratio (UACR) of 30–300 mg/g, microalbuminuria serves as an early indicator of diabetic nephropathy and is associated with systemic or endothelial dysfunction [3]. Importantly, microalbuminuria is an independent predictor of cardiovascular morbidity and mortality in patients with T2DM [3]. Furthermore, its prevalence increases with longer duration of diabetes and poor glycemic control [4], reflecting progressive microvascular damage.
The corrected QT (QTc) interval, assessed using electrocardiography, represents the duration of ventricular depolarization and repolarization. Prolongation of the QTc interval is clinically significant because it is associated with an increased risk of ventricular arrhythmias and sudden cardiac death [5]. In patients with diabetes, QTc prolongation has been reported in approximately 25–30% of cases [6]. and is influenced by factors such as disease duration, glycemic status, and associated complications [7].
There is growing interest in the relationship between microalbuminuria and QTc interval, as both may reflect underlying microvascular and autonomic dysfunction. Several studies have reported a significant association between microalbuminuria and prolonged QTc interval [8-10], suggesting that patients with diabetic nephropathy are at higher risk of cardiac autonomic neuropathy and arrhythmias. However, this association is not consistently observed, as other studies suggest that the QTc interval may not be directly linked to albumin excretion. Instead, it appears to be influenced by underlying determinants such as blood pressure and vascular dysfunction [11-12].
Moreover, most existing studies have primarily compared patients with and without microalbuminuria [8-9]. Limited data are available on the association between the QTc interval and the severity of albuminuria within the microalbuminuria range, particularly in real-world clinical settings. Therefore, the present study was conducted to evaluate the association between QTc interval and microalbuminuria in patients with T2DM, with particular emphasis on examining the relationship between QTc interval and albuminuria severity, as well as its association with diabetes duration and glycemic control.
Methods
Study design and setting
This was a hospital-based analytical cross-sectional study conducted in the the outpatient (OPD) and inpatient (IPD,) Departments of Medicine at Sri Guru Ram Das Institute of Medical Sciences and Research, Vallah, Sri Amritsar between July 2024 and December 2025.
Study population
Adult patients aged 18 years and above with a confirmed diagnosis of T2DM, in accordance with the American Diabetes Association criteria, were eligible for inclusion in the study. Patients attending the outpatient department or admitted to the inpatient department during the study period and willing to provide written informed consent were consecutively recruited.
Patients with conditions that could independently influence the QT interval were excluded from the study. These included individuals with known cardiac arrhythmias, those receiving medications known to prolong the QT interval (such as antiarrhythmic drugs and certain antibiotics), and patients with electrolyte imbalances, including hypokalemia, hypocalcemia, or hyponatremia. Additionally, patients with advanced chronic kidney disease, established ischemic heart disease, or structural cardiac abnormalities detected on echocardiography were excluded. Patients who were unwilling or unable to provide informed consent were also excluded from the study.
Sample Size
The sample size was calculated using the single proportion formula based on a reported prevalence of microalbuminuria of 60% from Mittal et al. [13].
Variables
Exposure variable: Microalbuminuria (UACR categories)
Outcome variable: QTc interval
Covariates: Age, gender, duration of diabetes, glycemic control (HbA1c), lipid profile, and blood pressure
Data Sources and Measurements
Demographic and clinical data were collected using a structured proforma. Physical examination included anthropometric measurements and vital signs.
Electrocardiography
A standard 12-lead ECG was recorded at rest. QT interval was measured in Lead II from the onset of the QRS complex to the end of the T wave. The corrected QT interval (QTc) was calculated using Bazett’s formula:
Assessment of Microalbuminuria
Spot urine samples were collected to estimate UACR, expressed in mg/g:
<30 mg/g: Normal
30–300 mg/g: Microalbuminuria
300 mg/g: Macroalbuminuria
However, in the present study cohort, all enrolled participants had UACR values within the microalbuminuria range (30–300 mg/g). Therefore, further analysis was performed to evaluate the association between the QTc interval and the severity of microalbuminuria.
For subgroup analysis, participants were stratified into three UACR-based categories: 30–100 mg/g, 101–200 mg/g, and 201–300 mg/g.
Laboratory Investigations
Blood samples were analyzed for complete blood count, fasting and random blood glucose, HbA1c, serum electrolytes, and lipid profile using standard laboratory methods.
Echocardiography
Two-dimensional echocardiography was performed to evaluate cardiac structure and function and to exclude structural heart disease.
Bias
To minimize measurement bias, all ECG recordings and laboratory investigations were performed using standardized procedures. The measurements of QT interval were conducted using a consistent method. Selection bias was minimized by including consecutive eligible patients during the study period.
Statistical analysis
Data were analyzed using SPSS version 26.0 (IBM Corp., Armonk, NY, USA). Continuous variables were expressed as mean (standard deviation [SD]), and categorical variables as frequencies and percentages.
Comparisons between groups were performed using the independent Student’s t-test for continuous variables and the chi-square test for categorical variables. One-way analysis of variance (ANOVA) was used to compare more than two groups. Correlation between QTc interval and UACR was assessed using Pearson’s or Spearman’s correlation coefficient, as appropriate. A two-tailed p-value <0.05 was considered statistically significant.
Results
A total of 100 patients with T2DM were enrolled in the study. The mean age of the participants was 60.12 (12.14) years, with males comprising 62% males and females 38%. All patients had UACR values within the microalbuminuria range (30–300 mg/g). The overall mean (SD) UACR was 121.21 (72.84) mg/g. Based on subgroup analysis, patients were categorized into: lower microalbuminuria (30–100 mg/g): 50%, moderate microalbuminuria (101–200 mg/g): 33%, and higher microalbuminuria (201–300 mg/g): 17%. The mean total cholesterol was 140.99 mg/dL, and the majority of the population (80%) had a total cholesterol level <200 mg/dL. The mean triglyceride was 170.10 mg/dL, and the majority of the population (54%) had a triglyceride level <150 mg/dL. The mean HDL was 33.07 mg/dL, and the majority of the population (66%) had an HDL level <40 mg/dL. The mean LDL was 86.39 mg/dL, and the majority of the population (67%) had an LDL level <100 mg/dL (Table 1).
| Characteristics | Total (N=100) |
| Age (years), mean (SD) | 60.12 (12.14) |
| Age groups | |
| ≤40 | 6 (6.0) |
| 41-50 | 21 (21.0) |
| 51-60 | 23 (23.0) |
| 61-70 | 27 (27.0) |
| 71-80 | 21 (21.0) |
| >80 | 2 (2.0) |
| Sex | |
| Male | 62 (62.0) |
| female | 38 (38.0) |
| History of alcohol intake | 29 (29.0) |
| UACR (mg/g), mean (SD) | 121.21 (72.84) |
| UACR category | |
| 30-100 | 50 (50.0) |
| 101-200 | 33 (33.0) |
| 201-300 | 17 (17.0) |
| Total cholesterol (mg/dL), mean (SD) | 140.99 (53.01) |
| Total cholesterol category | 140.99 (53.01) |
| <200 | 81 (81.0) |
| 200-239 | 16 (16.0) |
| ≥240 | 3 (3.0) |
| Triglyceride (mg/dL), mean (SD) | 170.10 (85.56) |
| Triglyceride category | |
| <150 | 54 (54.0) |
| 150-199 | 16 (16.0) |
| 200-499 | 30 (30.0) |
| HDL (mg/dL), mean (SD) | 33.07 (15.70) |
| HDL category | |
| <40 | 66 (66.0) |
| 40-59 | 29 (29.0) |
| >60 | 5 (5.0) |
| LDL (mg/dL), mean (SD) | |
| LDL category | 86.39 (40.38) |
| <100 | 67 (67.0) |
| 100-129 | 16 (16.0) |
| 130-159 | 12 (12.0) |
| 160-189 | 5 (5.0) |
| Daa presented as n (%), unless otherwise specified. HDL, high-density lipoprotein; LDL, low-density lipoprotein; UACR, urine albumin creatinine ratio. |
The mean QTc interval was 471.99 (51.20) ms, and QTc prolongation was observed in 65% of patients.
A progressive increase in QTc interval was observed with increasing levels of UACR. The mean QTc interval was 451.59 (53.63) ms in patients with UACR 30–100 mg/g, 465.74 (44.38) ms in those with UACR 101–200 mg/g, and 491.97 (54.42) ms in patients with UACR 201–300 mg/g. This trend was statistically significant on one-way analysis of variance (p = 0.013), indicating a stepwise increase in QTc interval with increasing severity of microalbuminuria.
A positive correlation was observed between QTc interval and UACR values; however, this association did not reach statistical significance (r = 0.053; p = 0.603) (Figure 1A). Similarly, the QTc interval showed negative correlations with HbA1c levels (Figure 1B) and diabetes duration (Figure 1C), but these associations were not statistically significant (r = -0.111; p = 0.272 and r = -0.057; p = 0.576, respectively). Similarly, no statistically significant association was observed between QTc interval and gender (p > 0.05).
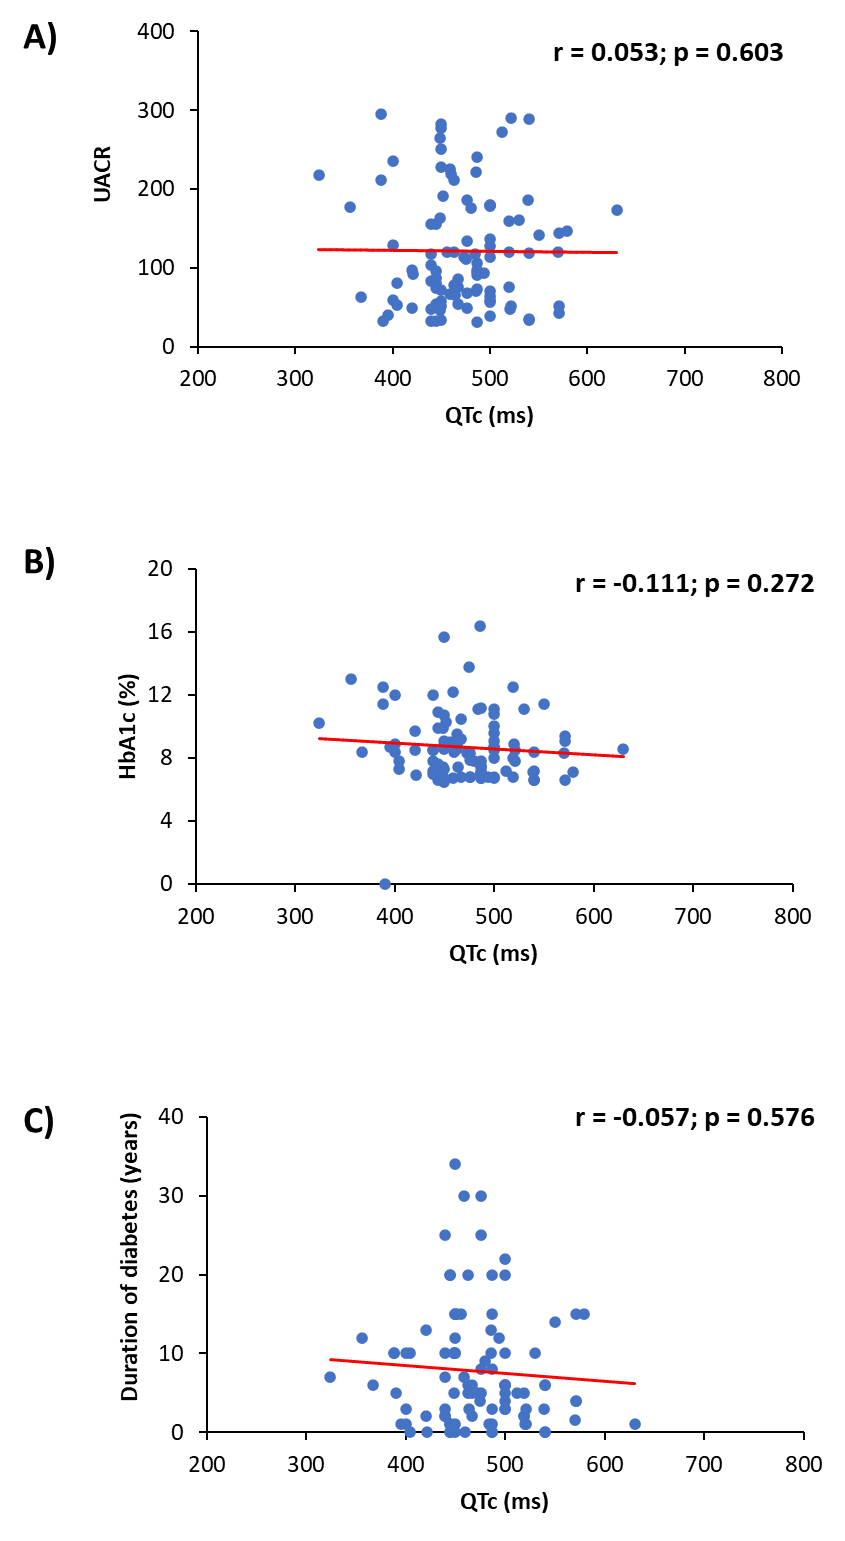
HbA1c, glycated hemoglobin; QTc, corrected QT; UACR, urine albumin creatinine ratio.
The Spearman correlation (r) was used to assess the association between two parameters.
In contrast, UACR showed a statistically significant positive correlation with HbA1c levels (r = 0.293; p = 0.003, Figure 2A) and duration of diabetes (r = 0.223; p = 0.020, Figure 2B), indicating that worsening glycemic control and longer disease duration were associated with increased albuminuria.
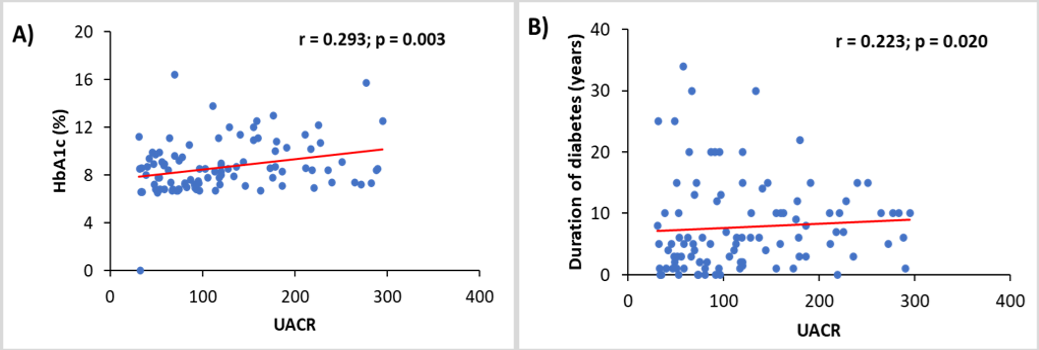
HbA1c, glycated hemoglobin; UACR, urine albumin creatinine ratio.
The Spearman correlation (r) was used to assess the association between two parameters.
When stratified according to UACR severity (30–100 mg/g, 101–200 mg/g, and 201–300 mg/g), a significant difference was observed in the diabetes duration across groups. Patients in the higher UACR category had a longer duration of diabetes (<5 years: 62.0%, 39.4%, 29.4%; ≥5 years: 38.0%, 60.6%, 70.6%, respectively; p = 0.027).
Mean HbA1c levels also increased significantly with increasing UACR severity, with values of 7.97%, 9.33%, and 9.43% across the three groups, respectively (p = 0.005).
In contrast, no significant association was observed between UACR severity and sex distribution (p = 0.295). Similarly, lipid parameters, including total cholesterol (p = 0.947), triglycerides (p = 0.704), HDL cholesterol (p = 0.490), and LDL cholesterol (p = 0.560), did not vary significantly across UACR categories (Table 2).
| Parameters | Severity of UACR | p-value | ||
| 30-100 (n=50) | 101-200 (n=33) | 201-300 (n=170 | ||
| Diabetes duration (years) | ||||
| <5 | 31 (62.0) | 13 (39.4) | 5 (29.4) | 0.027 |
| ≥5 | 19 (38.0) | 20 (60.6) | 12 (70.6) | |
| HbA1c (%), mean (SD) | 7.97 (2.10) | 9.33 (1.93) | 9.43 (2.39) | 0.005 |
| QTc, mean (SD) | 451.59 (53.63) | 465.74 (44.38) | 491.97 (54.42) | 0.013 |
| Sex | ||||
| Male | 19 (38.0) | 10 (30.3) | 9 (52.9) | 0.295 |
| Female | 31 (62.0) | 23 (69.7) | 8 (47.1) | |
| Total cholesterol (mg/dL) | ||||
| <200 | 40 (80.0) | 27 (81.8) | 14 (82.4) | 0.947 |
| 200-239 | 8 (16.0) | 5 (15.2) | 2 (17.6) | |
| ≥240 | 2 (4.0) | 1 (3.0) | 0 | |
| Triglyceride (mg/dL) | ||||
| <150 | 27 (54) | 18 (54.5) | 9 (52.9) | 0.704 |
| 150-199 | 9 (18.0) | 6 (18.2) | 1 (5.9) | |
| 200-499 | 14 (28.0) | 9 (27.3) | 7 (41.2) | |
| HDL (mg/dL) | ||||
| <40 | 31 (62.0) | 23 (69.7) | 12 (70.6) | 0.490 |
| 40-59 | 17 (34.0) | 7 (21.20 | 5 (29.4) | |
| >60 | 2 (4.0) | 3 99.1) | 0 | |
| LDL (mg/dL) | ||||
| <100 | 37 (74.0) | 20 (60.6) | 10 (58.8) | 0.560 |
| 100-129 | 5 (10.0) | 6 (18.2) | 5 (29.4) | |
| 130-159 | 6 (12.0) | 5 (15.2) | 1 (5.9) | |
| 160-189 | 2 (4.0) | 1 (5.9) | 1 (5.9) | |
| Data presented as n (%), unless otherwise specified. DBP, diastolic blood pressure; HDL, high-density lipoprotein; LDL, low-density lipoprotein; SBP, systolic blood pressure; UACR, urine albumin creatinine ratio. |
When biochemical and clinical parameters were compared between patients with a diabetes duration of <5 years and those with ≥5 years, a statistically significant increase was observed in mean UACR (p = 0.004), QT interval (p = 0.019), QTc interval (p = 0.024), SBP (p = 0.048), DBP (p = 0.030), and HbA1c (p = 0.039) levels ( Table 3). In contrast, lipid parameters did not differ significantly between the two groups (p > 0.05).
| Parameters | Diabetes duration | p value | |
| <5 (n=49) | ≥5 (N=51) | ||
| UACR | 100.33 (64.41) | 141.28 (75.40) | 0.004 |
| QT | 349.96 (43.58) | 384.23 (44.66) | 0.019 |
| QTc | 454.98 (50.51) | 489.29 (51.40) | 0.024 |
| SBP | 130.86 (25.79) | 139.90 (18.93) | 0.048 |
| DBP | 75.31 (11.92) | 79.78 (8.09) | 0.030 |
| HbA1c | 8.20 (1.98) | 9.11 (2.31) | 0.039 |
| Cholesterol | 139.02 (55.35) | 142.88 (51.16) | 0.718 |
| Triglyceride | 163.14 (84.76) | 176.78 (86.65) | 0.428 |
| HDL | 34.37 (15.60) | 31.82 (15.85) | 0.421 |
| LDL | 81.24 (38.40) | 91.33 (41.98) | 0.213 |
| Data presented as mean (SD). DBP, diastolic blood pressure; HDL, high-density lipoprotein; LDL, low-density lipoprotein; SBP, systolic blood pressure; UACR, urine albumin creatinine ratio. |
Discussion
The current study investigated the association between QTc interval and microalbuminuria in individuals with T2DM. A progressive increase in QTc interval was observed across UACR categories, correlation analysis did not reveal a statistically significant link between QTc interval and UACR. On the other hand, UACR showed a significant positive association with both HbA1c and the duration of diabetes. In the present study, the mean QTc interval ranged from 451.59 (53.63) ms to 491.97 (54.42) ms across increasing UACR categories, indicating relatively higher QTc values in the present study population. These findings are comparable to previously reported studies in patients with T2DM, where mean QTc values have generally been reported in the range of approximately 397 ms to 450 ms. A study evaluating QTc in diabetic patients reported a mean QTc of around 397 ms, reflecting relatively lower values compared to the present cohort [14]. Similarly, another study reported mean QTc values of approximately 450.9 (3.2) ms in patients with T2DM [6].
The comparatively higher QTc values observed in this study may be attributed to the presence of microalbuminuria in all participants, suggesting underlying microvascular and possibly autonomic dysfunction.
Additionally, differences in study populations, glycemic control, duration of diabetes, and comorbid conditions may account for variability in QTc values across studies. Overall, our findings are consistent with the existing literature suggesting that the QTc interval tends to be elevated in patients with T2DM, although the magnitude of prolongation varies across different cohorts.
In this study, 65% of patients showed QTc prolongation, highlighting a significant burden of cardiac electrical issues in individuals with T2DM. This findings are consistent with earlier studies that have also demonstrated a notable prevalence of QTc prolongation among diabetic groups. One study reported approximately 51% of T2DM patients with prolonged QTc intervals [6], while other studies have reported prevalence rates between 30% and 47%, influenced by population specifics and glycemic management [10,15].
Several prior studies have identified a strong link between the QTc interval and microalbuminuria. Research indicates that patients with microalbuminuria tend to have a higher incidence of extended QTc intervals, pointing to a connection between diabetic nephropathy and cardiac autonomic neuropathy [10]. Similarly, it has been shown that microalbuminuria is significantly associated with prolonged QTc, longer diabetes duration, and poor glycemic control [8]. These results support the idea that both QTc prolongation and albuminuria are markers of microvascular and autonomic dysfunction.
However, the relationship between QTc interval and albuminuria has shown variability across different studies. In contrast to the findings discussed above, one study observed that although QTc interval values were higher among patients with microalbuminuria, no strong correlation was demonstrated with the albumin excretion rate on regression analysis [11]. Similarly, another study has demonstrated no significant association between QT parameters and proteinuria, despite prolonged QT intervals in diabetic patients [12]. These observations are consistent with the findings of the present study.
The lack of a statistically significant correlation between QTc interval and UACR in our study may be attributed to several factors. First, all participants in the present study had UACR values within the microalbuminuria range, thereby limiting the variability required to detect a strong linear association. Second, QTc prolongation is influenced by multiple factors, including autonomic dysfunction, blood pressure, metabolic disturbances, and electrolyte imbalances, rather than albuminuria alone. As reported in previous studies, QTc prolongation and microalbuminuria may reflect shared underlying pathophysiological mechanisms rather than a direct cause–effect relationship [11].
In contrast, the present study demonstrated a significant association between UACR and both HbA1c levels and duration of diabetes. This finding agrees with previous literature that has identified poor glycemic control and longer disease duration as important predictors of microalbuminuria. Chronic exposure to hyperglycemia. is known to induce progressive glomerular injury, leading to increased urinary albumin excretion [16]. Furthermore, microalbuminuria has been associated with markers of cardiovascular risk and disease progression [17].
However, no significant relationship was observed between QTc interval and HbA1c levels or duration of diabetes in the present study. While some studies have reported a positive correlation between QTc interval and glycemic control or duration of diabetes, others have demonstrated inconsistent or weak associations [17-18]. This variability further supports the notion that the QTc interval is influenced by complex and multifactorial mechanisms rather than a single parameter.
Study Limitations
The absence of a normoalbuminuric control group is a primary limitation of the present study, which restricts our ability to evaluate the categorical relationship between microalbuminuria and QTc prolongation. Additionally, cardiac autonomic function testing was not incorporated, which would have allowed for a more mechanistic evaluation of whether CAN mediates QTc prolongation independently of renal disease.
Future Directions
Future studies employing stratified designs with normoalbuminuric, microalbuminuric, and macroalbuminuric cohorts, combined with formal CAN assessment, would better delineate the hierarchical relationships among glycemic control, autonomic dysfunction, renal involvement, and ventricular repolarization in T2DM.
In conclusion
Overall, the findings of the present study suggest that although QTc prolongation and microalbuminuria frequently coexist in patients with T2DM, the QTc interval may not be directly related to the severity of albuminuria. Instead, both parameters may reflect underlying systemic vascular and autonomic dysfunction. The significant association of UACR with HbA1c and duration of diabetes highlights the importance of glycemic control and early disease management in preventing microvascular complications.
Clinical Significance
-
Prolongation of QTc was common in T2DM patients with microalbuminuria, indicating elevated cardiovascular autonomic risk.
-
The QTc interval increased with higher UACR categories, though no significant linear correlation was observed.
-
A significant association was observed between microalbuminuria, poor glycemic control, and longer duration of diabetes.
-
Combined assessment of UACR and QTc may support early cardiovascular risk stratification in T2DM patients.
Declarations
Ethical Clearance
The study protocol has been approved by the Institutional Ethics Committee (Ref no. SGRD/IEC/2024.362; Date of Approval: June 3, 2024) of Sri Guru Ram Das Institute of Medical Sciences and Research, Sri Amritsar, and was conducted in accordance with the ethical guidelines of the Declaration of Helsinki (2000).
Acknowledgements
None
Conflict of interest
All authors declare that they have no conflicts of interest.
Funding/ financial support
This study did not receive any funding.
Author’s Contributors
JK and RSB contributed to the concept and design of the study. JK and RSB contributed to acquisition of data. JK and RSB participated in data analysis and interpretation of data. JK and RSB were involved in drafting the manuscript and critical revision. All authors critically reviewed the manuscript and provided approval on the final draft being submitted, and take complete responsibility of data accuracy. All authors met the International Committee of Medical Journal Editors (ICMJE) authorship criteria and all those who met the ICMJE authorship criteria are listed as authors.
Trial details
Not applicable