1. Introduction and Historical Perspective
In 1988, Dr. Gerald M. Reaven presented a groundbreaking hypothesis during the Banting Award lecture at the American Diabetes Association, introducing the concept of "Syndrome X" to describe a clustering of metabolic abnormalities characterized by insulin resistance as the central pathophysiological feature (Reaven, 1988). This seminal contribution fundamentally altered understanding of metabolic disease, establishing insulin resistance as a critical driver of multiple disease states including type 2 diabetes mellitus (T2DM), cardiovascular disease (CVD), and dyslipidemia. While initially controversial, Reaven's concept has been extensively validated by subsequent decades of research demonstrating that this syndrome represents a constellation of interrelated metabolic abnormalities sharing common genetic and pathophysiological underpinnings (Després, 2018).
The evolution of Syndrome X terminology has resulted in its broader recognition as "metabolic syndrome" (MetS), which has become central to modern clinical practice and public health initiatives worldwide (Després, 2018). The metabolic syndrome now encompasses diagnostic criteria that typically include central obesity, elevated blood pressure, dyslipidemia (elevated triglycerides and reduced HDL cholesterol), and impaired glucose regulation or T2DM. What distinguishes Reaven's Syndrome X from simple metabolic syndrome definitions is the explicit recognition that insulin resistance is the fundamental biological driver linking genetic susceptibility to environmental exposures and resulting in this characteristic phenotype (Reaven, 1988).
Decades of genetic research have revealed that Syndrome X is fundamentally a polygenic disorder with substantial heritability, explained by multiple common and rare genetic variants, each contributing modest effects that are substantially modulated by environmental factors (Després, 2018). The identification of susceptibility loci through genome-wide association studies (GWAS), linkage analyses, and candidate gene approaches has illuminated the molecular pathways dysregulated in this condition. This review synthesizes current evidence regarding the genetic architecture of Syndrome X, focusing on major candidate genes, chromosomal loci, and the molecular mechanisms by which genetic variants predispose to insulin resistance and its metabolic consequences.
2. Genetic Architecture and Heritability of Metabolic Syndrome
2.1 Heritability Estimates and Population-Specific Findings
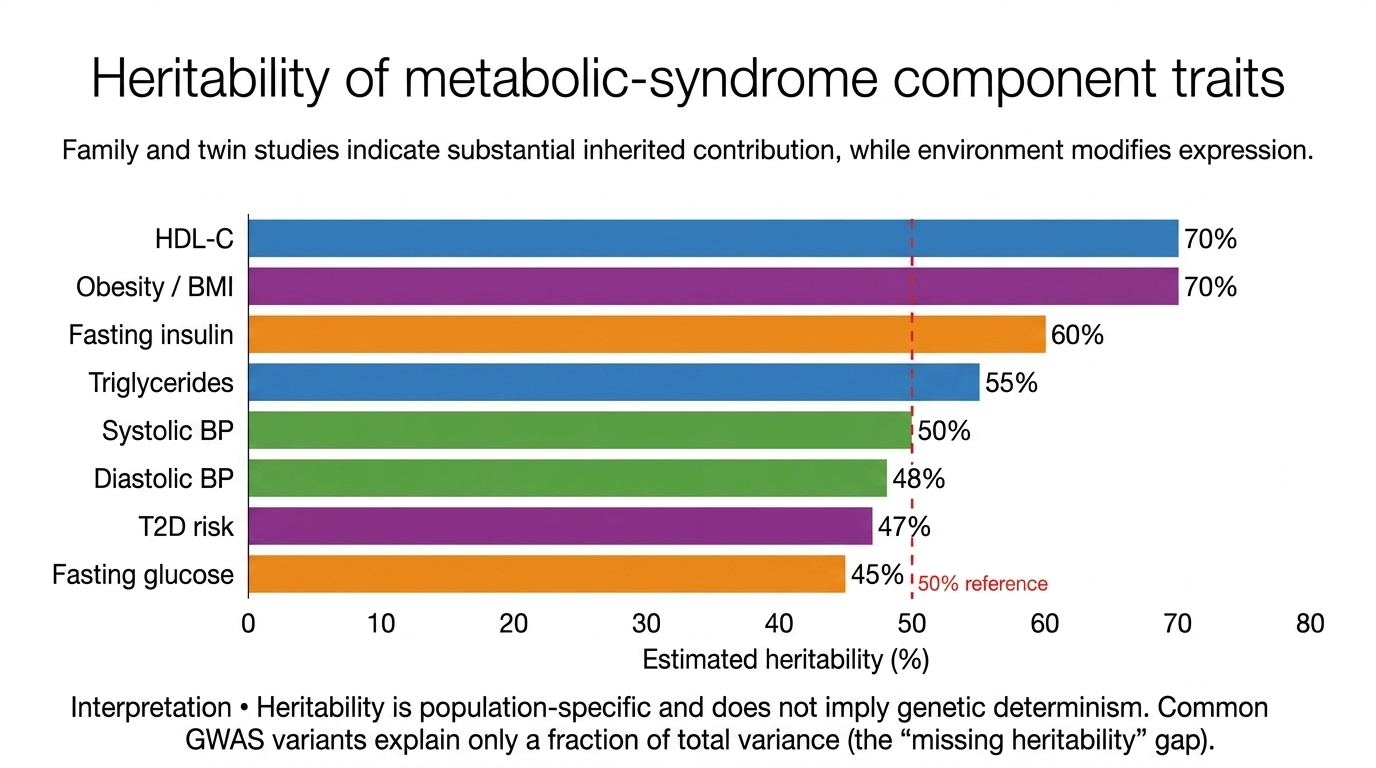
Twin and family studies have provided compelling evidence that all component traits of Syndrome X demonstrate substantial heritability. Most metabolic syndrome phenotypes exhibit heritabilities ranging from 40-70%, with certain traits such as obesity and HDL cholesterol showing heritabilities as high as 70% in some populations. Fasting insulin levels demonstrate approximately 60% heritability, triglycerides 55%, blood pressure 48-50%, and fasting glucose 45% (Després, 2018). This high heritability indicates that genetic factors constitute a substantial proportion of the variance in these traits, although environmental factors including diet, physical activity, and lifestyle significantly modulate genetic predisposition. Importantly, heritability estimates vary across populations and are population-specific, reflecting both genetic diversity and differential environmental exposures across different ethnic and geographic groups.
A paradoxical finding that has emerged from genetic research is that despite these high heritabilities, genome-wide association studies have identified common genetic variants that collectively explain only approximately 5-10% of the phenotypic variance in most metabolic syndrome traits (Després, 2018). This observation has been termed the "missing heritability" problem and suggests that the genetic architecture underlying Syndrome X is more complex than initially anticipated. The unidentified genetic component likely comprises hundreds of genes with modest individual effects, rare mutations not detected by standard GWAS approaches, and complex gene-gene and gene-environment interactions that are difficult to dissect in human populations.
2.2 Population Genetics and Ethnic Variation
The prevalence of metabolic syndrome varies substantially across ethnic groups, reflecting both genetic and environmental differences. Hispanic/Latino and Native American populations demonstrate higher prevalence rates (approximately 35-40%), followed by African-American populations (approximately 30-35%), while East Asian populations show lower prevalence (approximately 15-20%) despite high obesity rates (Després, 2018). For instance, the FTO obesity-associated alleles show substantially higher frequency in European populations (approximately 40-45% for risk alleles) compared to East Asian populations (approximately 15-20%), partly explaining differences in obesity susceptibility across populations.
3. Major Chromosomal Loci and Candidate Genes
3.1 Chromosome 6q: A Critical Susceptibility Region
One of the most reproducible and significant genetic findings in Syndrome X research has been the identification of major quantitative trait loci (QTLs) on chromosome 6q that influence multiple metabolic syndrome phenotypes. Landmark linkage studies in Mexican-American families identified two adjacent regions on chromosome 6q showing strong evidence of linkage to an "adiposity-insulin factor" (comprising body mass index, leptin, and fasting insulin levels) (Arya et al., 2002). The region near marker D6S403 (6q24.1-q24.2) showed logarithm of odds (LOD) score of 4.2, while the region near marker D6S264 (6q25.2-q26) demonstrated a LOD score of 4.9, both exceeding the threshold for significant linkage (Arya et al., 2002). These results provided strong evidence for pleiotropy—a single genetic locus influencing multiple correlated traits.
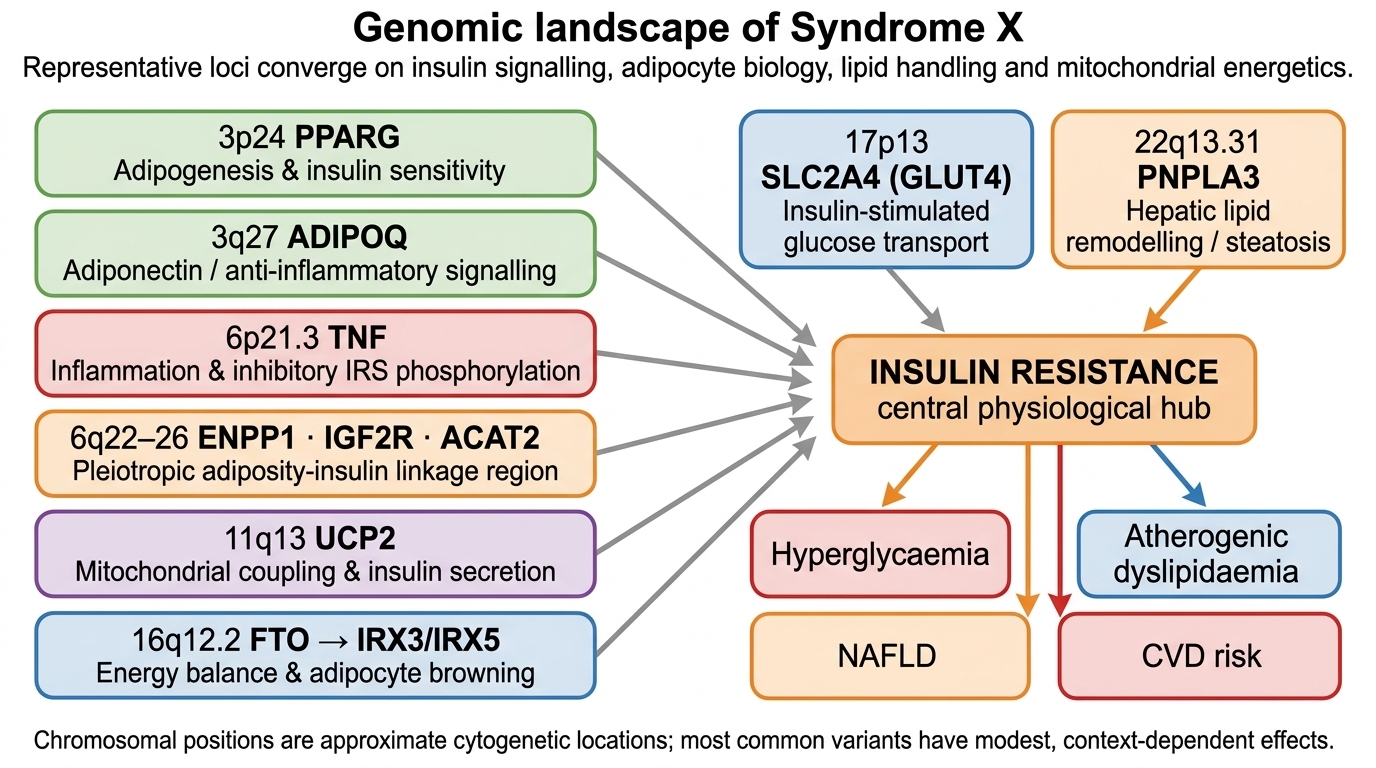
The chromosome 6q region contains several biologically plausible candidate genes for insulin resistance. The PC-1 (plasma cell membrane glycoprotein) gene located at 6q22-q23 encodes an insulin receptor antagonist; overexpression of PC-1 reduces insulin-stimulated glucose uptake in cell culture models (Arya et al., 2002). Additional candidate genes in this region include IGF2R (insulin-like growth factor 2 receptor) at 6q26 and ACAT2 (acetyl-CoA acetyltransferase 2) at 6q25.3-q26, both involved in metabolic homeostasis. The ADIPOQ gene (encoding adiponectin) is also located on chromosome 3q27 and serves as a critical susceptibility locus for metabolic syndrome, type 2 diabetes, and cardiovascular disease.
3.2 Other Significant Chromosomal Loci
Beyond the chromosome 6q region, genome-wide linkage scans have identified multiple additional QTLs contributing to Syndrome X phenotypes. Chromosome 10p and 19q show suggestive linkage to metabolic syndrome in Caucasian populations, while chromosome 1q demonstrates significant linkage in African-American families (North et al., 2005). Chromosome 4q has been linked to a glucose/insulin/obesity factor (robust LOD = 2.2), and chromosome 12q shows linkage to dyslipidemia factors (robust LOD = 2.7) (North et al., 2005). These diverse chromosomal regions indicate the polygenic nature of metabolic syndrome and the involvement of multiple independent genetic mechanisms in its pathogenesis.
4. Key Candidate Genes and Their Functions
4.1 Insulin Signaling Cascade Genes: IRS1, IRS2, INSR, PI3K, and AKT
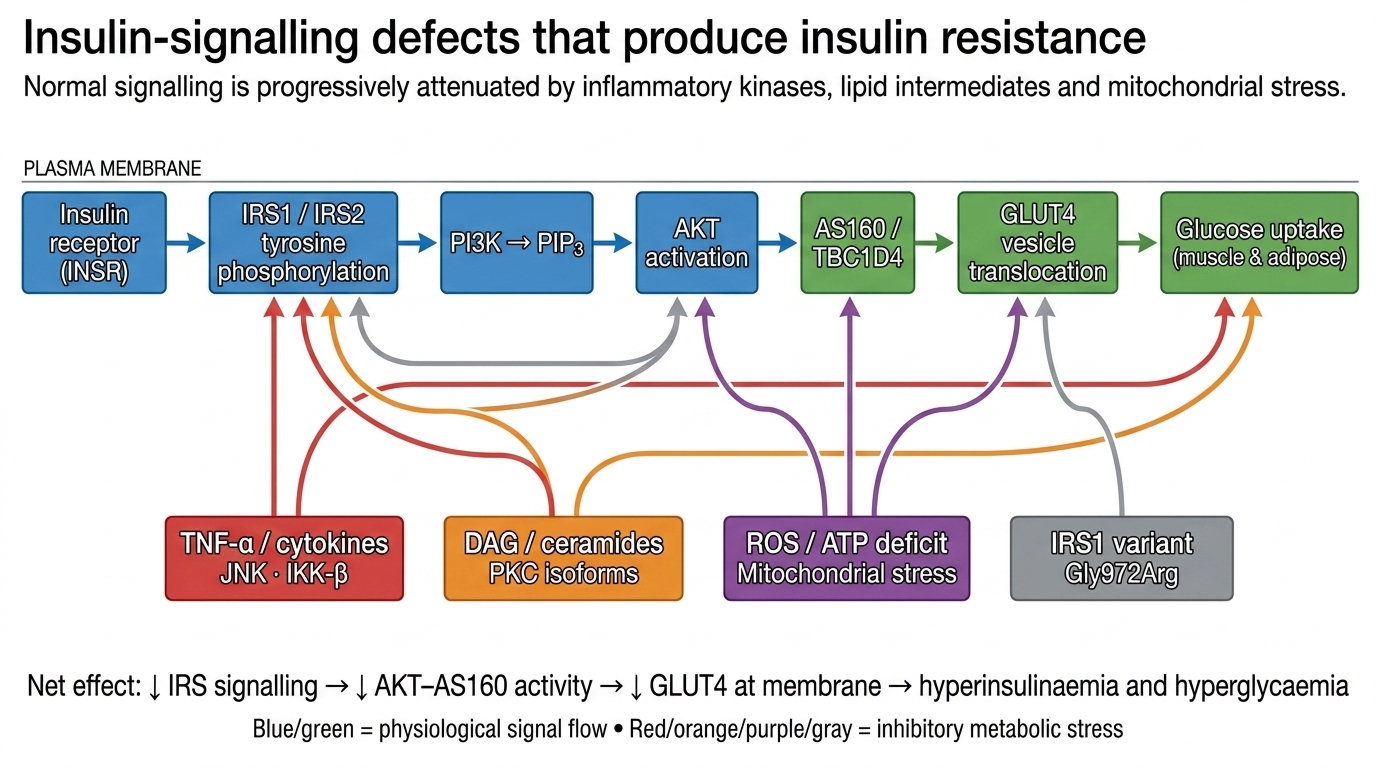
The insulin receptor substrate (IRS) family proteins represent critical nodes in insulin signal transduction. IRS1 and IRS2 function as signaling adapter proteins that, upon tyrosine phosphorylation by the insulin receptor, recruit and activate downstream effectors including phosphatidylinositol 3-kinase (PI3K) and the growth factor receptor-bound protein 2 (Grb-2) complex. PI3K generates phosphatidylinositol 3,4,5-triphosphate (PIP3), which recruits and activates AKT through phosphorylation by PDK1 .
Recent genetic studies have identified reduced IRS1 and IRS2 expression in adipose tissue and skeletal muscle from obese and insulin-resistant individuals (Kovacs et al., 2003). The IRS1 polymorphism rs1801278 (Gly972Arg substitution) has been particularly well-characterized. Yousef et al. (2018) demonstrated that individuals carrying the GA and GA+AA genotypes of IRS1 rs1801278 showed significantly higher frequency of insulin resistance and type 2 diabetes compared to GG homozygotes. Fasting blood glucose (FBG), fasting plasma insulin (FPI), and HOMA-IR (Homeostasis Model Assessment for Insulin Resistance) were significantly elevated in patients with the GA+AA genotypes, indicating that IRS1 genetic variants represent significant genetic determinants for insulin resistance during T2DM (Yousef et al., 2018).
4.2 GLUT4 and Glucose Transporter Dysfunction
The GLUT4 glucose transporter, located on chromosome 17p13, mediates insulin-stimulated glucose uptake in skeletal muscle and adipose tissue—tissues responsible for approximately 80% of whole-body glucose utilization. Although genetic variants in the GLUT4 gene itself are rare and show limited association with type 2 diabetes, reduced GLUT4 expression and impaired translocation to the plasma membrane constitute cardinal features of insulin resistance. The PGC-1α coactivator controls endogenous GLUT4 gene expression through interactions with the transcription factor MEF2C, and dysregulation of this axis can reduce GLUT4 availability and glucose transport capacity.
4.3 PPAR-γ: Master Regulator of Adipogenesis and Insulin Sensitivity
The peroxisome proliferator-activated receptor gamma (PPARγ) gene, located on chromosome 3p24, encodes a nuclear receptor that serves as a master transcriptional regulator of adipogenesis and insulin sensitivity (Sanghera et al., 2010). PPARγ activates genes required for adipocyte differentiation, adipokine production, and fatty acid uptake. Sanghera et al. (2010) examined the association of 14 tagging single nucleotide polymorphisms (tagSNPs) in PPARG genes and found that genetic variation in PPARG loci could contribute significantly to risk for T2D development in Asian Indian Sikhs. The Pro12Ala polymorphism in the PPARγ gene has been extensively studied, with the Ala allele showing association with reduced body mass index and improved insulin sensitivity in many (though not all) populations.
The mechanisms by which PPARγ improves insulin sensitivity appear paradoxical—PPAR agonists (thiazolidinediones) promote adipogenesis and weight gain in humans yet paradoxically improve insulin sensitivity. Significant research has demonstrated that thiazolidinedione derivatives markedly enhance the expression and secretion of adiponectin in vitro and in vivo through the activation of the adiponectin promoter, and these compounds also antagonize the suppressive effect of TNF-α on the production of adiponectin (Maeda et al., 2001). Current evidence suggests that PPARγ agonists improve metabolic function by promoting the differentiation of preadipocytes into mature adipocytes, facilitating triglyceride storage in subcutaneous adipose tissue, and reducing lipid accumulation in non-adipose tissues (liver, muscle) where lipid intermediates induce insulin resistance.
4.4 Adiponectin (ADIPOQ) and the Anti-inflammatory Phenotype
Adiponectin, encoded by the ADIPOQ gene on chromosome 3q27, functions as an important insulin-sensitizing adipokine with anti-inflammatory properties. The plasma adiponectin concentration is decreased in insulin-resistant states, such as obesity and type 2 diabetes (Maeda et al., 2001). Multiple single-nucleotide polymorphisms (SNVs) in the ADIPOQ gene have been identified in association with altered adiponectin levels and metabolic dysfunction. Recent comprehensive analysis shows that genetic variations in the ADIPOQ gene influence adiponectin expression and that individuals with lower adiponectin levels show increased risk of metabolic syndrome components, including elevated triglycerides and dyslipidemia (Błażejewska et al., 2025).
The role of ADIPOQ polymorphisms in metabolic disease has been extensively studied. Sanghera et al. (2010) examined 5 tagSNPs in the ADIPOQ gene and found significant associations with T2D and related phenotypes. Two quantitative trait loci that influence the phenotypes of insulin resistance and metabolic syndrome have been identified, with one located on chromosome 3q27, where the adiponectin gene is encoded (Maeda et al., 2001). This genetic location represents a major susceptibility locus for metabolic syndrome components.
4.5 TNF-α and Inflammatory Pathways
Tumor necrosis factor alpha (TNF-α), encoded by the TNF gene on chromosome 6p21.3, functions as a pro-inflammatory cytokine substantially elevated in adipose tissue of obese individuals. Plomgaard et al. (2005) demonstrated that TNF-α infusion in healthy humans induces insulin resistance in skeletal muscle in a manner independent of effects on endogenous glucose production. TNF-α directly impairs insulin signaling through multiple mechanisms: (1) downregulation of IRS1 and IRS2 protein expression, (2) activation of serine/threonine kinases that phosphorylate IRS proteins at inhibitory sites, preventing their interaction with the insulin receptor, (3) stimulation of lipolysis leading to elevated free fatty acids that induce insulin resistance, and (4) negative regulation of PPARγ expression (Plomgaard et al., 2005).
Plomgaard et al. (2005) showed that TNF-α infusion leads to increased serine phosphorylation of IRS-1 at site 312 and impairs the phosphorylation of Akt substrate 160 (AS160), the most proximal step in the canonical insulin signaling cascade regulating GLUT4 translocation and glucose uptake. Elevated TNF-α levels in obesity and metabolic syndrome promote a pro-inflammatory state that perpetuates insulin resistance and contributes to endothelial dysfunction and atherosclerosis development.
Recent epidemiological studies confirm the association between TNF-α and metabolic dysfunction. Olson et al. (2012) examined circulating TNF-α levels in a large, multiethnic population and found that TNF-α levels were elevated in individuals with impaired glucose tolerance (IGT; 3.3 pg/ml in normal glucose tolerance vs. 3.5 pg/ml in IGT and 3.7 pg/ml in type 2 diabetes, p<0.05). Increased TNF-α levels were predominantly associated with insulin resistance but not with primary defects in β-cell function, confirming TNF-α's central role in the pathophysiology of metabolic syndrome (Olson et al., 2012).
4.6 FTO Gene: The Obesity-Associated Locus
The FTO (fat mass and obesity-associated) gene, located on chromosome 16q12, represents one of the most robust and reproducible genetic associations with obesity identified through GWAS. The rs9939609 single-nucleotide polymorphism in the first intron of FTO has been consistently associated with elevated BMI across multiple populations (Dina et al., 2007). With each copy of the risk A allele associated with approximately 0.3 kg/m² increase in BMI (Frayling et al., 2007). Recent studies have confirmed these associations: Huang et al. (2022) documented that multiple FTO SNPs in the intron 1 region are strongly associated with BMI, body fat rate, waist circumference, hip circumference, and energy intake. Studies in Brazilian populations showed a strong association between FTO variants and extreme obesity, with carriers of the AT haplotype having an increased risk for extreme obesity, with gene scores suggesting that the risk of developing extreme obesity was increased 1.37-fold per risk allele added (da Fonseca et al., 2020).
Mechanistic studies demonstrate that FTO variants regulate the IRX3-IRX5 pathway, which controls browning of white adipose tissue and the shift from energy-dissipating beige adipocytes to energy-storing white adipocytes (Smemo et al., 2014; Lan et al., 2020). The A allele increases FTO expression in human fibroblasts and blood cells, resulting in higher demethylase activity that reduces m⁶A methylation of IGF2/H19 RNA, promoting insulin/IGF signaling in myoblasts.
4.7 Genes Affecting Lipid Metabolism: APOE, APOB, PNPLA3, TM6SF2
Patatin-like phospholipase domain-containing 3 (PNPLA3), located on chromosome 22q13.31, encodes a membrane protein involved in triglyceride hydrolysis. The I148M variant (rs738409, c.444C>G) represents the most common genetic variant associated with non-alcoholic fatty liver disease (NAFLD) progression in metabolic syndrome. Romeo et al. (2008) conducted a genome-wide association scan of nonsynonymous sequence variations in a population comprising Hispanic, African American and European American individuals (n = 9,229). The allele rs738409[G] encoding I148M was strongly associated with increased hepatic fat levels (P = 5.9 × 10⁻¹⁰) and with hepatic inflammation (P = 3.7 × 10⁻⁴). Hepatic fat content was more than twofold higher in PNPLA3 rs738409[G] homozygotes than in noncarriers (Romeo et al., 2008).
More recent studies confirm the significant role of PNPLA3 in NAFLD progression. Yuan et al. (2020) noted that PNPLA3 I148M is now firmly established as a genetic modifier of hepatic steatosis and a risk factor for steatohepatitis, fibrosis, and hepatocellular carcinoma. A meta-analysis of 14,266 NAFLD subjects demonstrated that PNPLA3 M-variants (GG and GC) were associated with a 3.24-fold and 2.14-fold higher odds of hepatocellular carcinoma (HCC) than homozygous wild-type (CC) carriers (Yuan et al., 2020). The distribution of risk allele varies globally, with those of Hispanic and Asian ancestry more likely to carry the M variant, reflecting the higher prevalence of NAFLD in these populations (Yuan et al., 2020).
| Gene | Chromosome | Primary Function | Role in Syndrome X | Key Finding/Polymorphism | Citation |
| IRS1/IRS2 | 2q36 | Insulin receptor signaling adapter | Reduced expression; inhibitory Ser phosphorylation | rs1801278 (Gly972Arg) associated with T2DM; ↑HOMA-IR in GA+AA genotypes | (Yousef et al., 2018) |
| INSR | 19p13.3 | Insulin binding and tyrosine kinase | Mutations cause severe IR | Loss-of-function mutations cause extreme insulin resistance | |
| PPARγ | 3p24 | Transcriptional regulation, adipogenesis | Promotes adipocyte differentiation; ↑adiponectin | Pro12Ala polymorphism; TZD response marker | (Sanghera et al., 2010) |
| ADIPOQ | 3q27 | Adipokine, insulin sensitization | Major susceptibility locus; ↑adiponectin improves IR | Multiple SNPs associated with altered levels; rs1501299 | (Błażejewska et al., 2025) |
| TNF-α | 6p21.3 | Pro-inflammatory cytokine | Elevated in obesity; suppresses IRS1/2; Ser phosphorylates IRS | −308G>A promoter variant; TNF-α infusion induces muscle IR | (Plomgaard et al., 2005) |
| FTO | 16q12 | RNA demethylase, energy metabolism | Regulates adipocyte browning via IRX3-IRX5 | rs9939609: 0.3 kg/m² per risk A allele; 1.37-fold obesity risk in Brazilians | (Huang et al., 2022) |
| PNPLA3 | 22q13.31 | Triglyceride hydrolysis | Major NAFLD locus; ↑hepatic steatosis | I148M (rs738409): 2.2-fold ↑hepatic fat; 3.24-fold HCC risk | (Romeo et al., 2008) |
| TM6SF2 | 19p13.3 | VLDL secretion regulation | Affects hepatic lipid handling | rs10401969 reduces expression; ↑hepatic steatosis | (Choudhary et al., 2021) |
| UCP2 | 11q13 | Mitochondrial thermogenesis | Controls heat dissipation; ↓expression promotes obesity | Ala55Val: sex-dependent obesity risk; 45bp I/D polymorphism | (Surniyantoro et al., 2018) |
| PC-1 | 6q22-q23 | Insulin receptor antagonist | Chromosome 6q locus; impairs glucose uptake | Positional candidate gene on linkage locus (LOD = 4.9) | (Arya et al., 2002) |
| IGF2R | 6q26 | IGF-II receptor signaling | Linked to metabolic dysfunction | Chromosome 6q pleiotropic region | (Arya et al., 2002) |
| ACAT2 | 6q25.3-q26 | Lipid metabolism | Cholesterol esterification in intestine/liver | Chromosome 6q candidate gene | (Arya et al., 2002) |
| GLUT4 | 17p13 | Glucose transporter | Impaired translocation in IR; ↓expression in obesity | Rare variants; SLC2A4 regulatory SNPs | |
| AKT/PKB | 1q41-q42, 19q13.1 | Glucose signaling kinase | Essential for GLUT4 translocation; Ser/Thr kinase | Reduced phosphorylation of AS160 in IR | (Plomgaard et al., 2005) |
| PI3K | 5q13 | Phosphatidylinositol 3-kinase | PI3K/AKT pathway central to glucose homeostasis | Impaired in insulin resistance | (Plomgaard et al., 2005) |
| APOE | 19q13.2 | Lipoprotein metabolism | Cholesterol homeostasis; dyslipidemia risk | ε4 allele: ↑lipids and MetS risk; ε2 protective | (Choudhary et al., 2021) |
| APOB | 2p24.1 | Lipoprotein B structure | VLDL and LDL production | Affects triglyceride levels and dyslipidemia | (Choudhary et al., 2021) |
| mtDNA | Mitochondrial | Energy production (OXPHOS) | Multiple mutations cause T2DM; ↑ROS | m.3243A>G, ND1 T4216C, ND2 C5178A | (Jiang et al., 2017) |
| Mfn1/Mfn2 | Variable nuclear | Mitochondrial fusion/fission dynamics | Impaired dynamics precipitate metabolic dysfunction | Essential for maintaining mitochondrial membrane potential | (Ding et al., 2023) |
5. Molecular Mechanisms and Pathophysiology of Insulin Resistance
5.1 IRS Dysregulation and Ser/Thr Phosphorylation
The primary mechanism of insulin resistance in Syndrome X involves impaired function of insulin receptor substrate proteins. In obesity, multiple pathways converge to reduce IRS1/IRS2 expression and increase inhibitory serine phosphorylation at residues 307/312. JNK1/2 (c-Jun N-terminal kinases) and IKK-β (inhibitor of κB kinase-β) are activated during chronic inflammation and TNF-α exposure, leading to phosphorylation of IRS proteins at inhibitory serine residues. This serine phosphorylation prevents the interaction of IRS proteins with both the insulin receptor tyrosine kinase domain and downstream signaling molecules, effectively blocking the cascade. Yousef et al. (2018) showed that individuals with IRS1 rs1801278 GA+AA genotypes demonstrate this dysregulation, with significantly elevated HOMA-IR values compared to GG homozygotes.
5.2 TNF-α-Mediated Inflammation and Lipid Accumulation
TNF-α elevation in obesity creates a pro-inflammatory milieu that directly suppresses IRS1/IRS2 expression through NF-κB-dependent transcriptional mechanisms. Beyond IRS suppression, TNF-α activates lipolysis in adipose tissue, increasing circulating free fatty acids (FFAs). These FFAs are taken up by non-adipose tissues (skeletal muscle, liver), where they accumulate as diacylglycerols (DAGs) and ceramides. Both DAG and ceramides activate protein kinase C (PKC) isoforms, which phosphorylate IRS1 at inhibitory sites, perpetuating the cascade of insulin resistance. Plomgaard et al. (2005) demonstrated in a human experimental model that TNF-α infusion leads to increased serine phosphorylation of IRS-1 at Ser312 and subsequent impairment of AS160 phosphorylation, directly impairing GLUT4 translocation and glucose uptake.
The genetic basis for lipid accumulation involves variants in genes regulating triglyceride metabolism. Romeo et al. (2008) demonstrated that PNPLA3 I148M carriers have markedly elevated hepatic lipid content, creating a lipid-abundant environment that induces insulin resistance in hepatocytes and contributes to systematic metabolic dysfunction.
5.3 GLUT4 Translocation Defects and Glucose Transport Impairment
Downstream of the IRS/PI3K/AKT signaling cascade, glucose transporter 4 (GLUT4) translocation to the plasma membrane is critically dependent on intact insulin signaling. In insulin-resistant states, both reduced expression of GLUT4 and impaired translocation contribute to decreased glucose uptake capacity. GLUT4 translocation requires coordinated action of the SNARE (soluble N-ethylmaleimide-sensitive factor attachment receptor) protein complex, which mediates the fusion of GLUT4-containing vesicles with the plasma membrane. Reduced PGC-1α expression in insulin resistance (often associated with mitochondrial dysfunction) leads to decreased GLUT4 transcription, while impaired AKT signaling reduces the calcium-dependent activation of SNARE complex assembly, resulting in defective exocytosis.
5.4 Mitochondrial Dysfunction and ATP Deficit
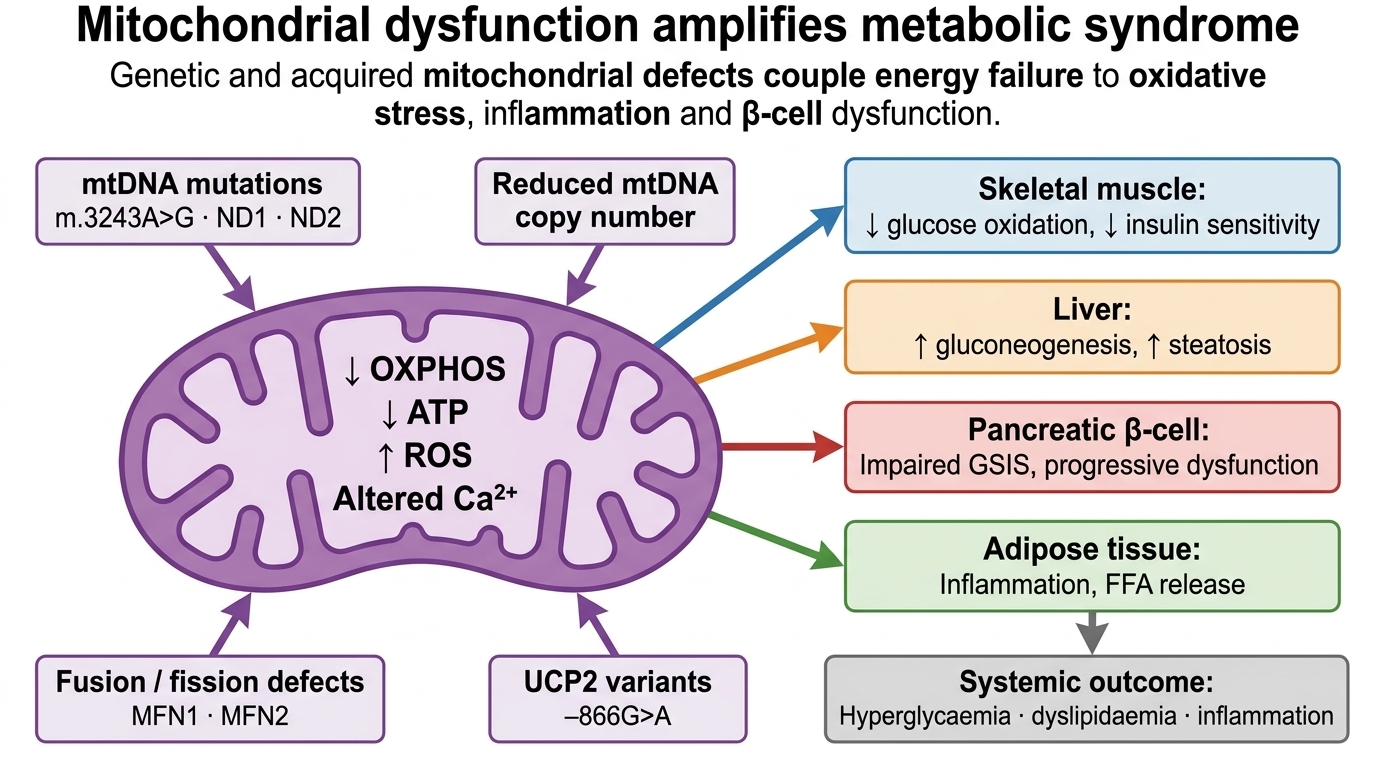
Mitochondrial dysfunction represents a fundamental mechanism underlying metabolic syndrome, contributing to reduced ATP production, increased reactive oxygen species (ROS) generation, and impaired thermogenesis. Multiple genetic mechanisms precipitate mitochondrial dysfunction: mtDNA mutations (including the m.3243A>G transition mutation commonly associated with maternal diabetes), mutations in nuclear genes encoding mitochondrial proteins, and variants affecting mitochondrial dynamics (Mfn1/Mfn2 fusion genes). Ding et al. (2023) reviewed mitochondrial DNA abnormalities and metabolic syndrome, noting that mtDNA mutations, deletions, and copy number loss disrupt the energy production capacity of mitochondria, leading to generation of excess ROS which causes oxidative damage to DNA, proteins, and lipids.
| Pathophysiological Mechanism | Molecular Basis | Genetic Contributors | Tissue-Specific Effects | Compensatory Consequences | Citation |
| IRS1/IRS2 Dysregulation | ↓protein expression; ↓tyrosine phosphorylation | IRS1 rs1801278; IRS2 variants; obesity-induced suppression | Skeletal muscle (primary), liver, adipose tissue | ↓PI3K recruitment; ↓AKT activation; impaired glucose signaling | (Yousef et al., 2018) |
| Ser/Thr Phosphorylation of IRS | JNK, IKK-β phosphorylate IRS at Ser307/312 | JNK1/2 variants; IKK-β inflammatory pathway genes; TNF-α elevation | Skeletal muscle >> liver, adipose tissue | Blocks IRS/IR interaction; prevents downstream signaling cascade | (Plomgaard et al., 2005) |
| TNF-α-Mediated Inflammation | TNF-α ↓IRS1/2 expression; activates MAPK/NF-κB | TNF-α chromosome 6p21.3; TNF-α −308G>A polymorphism | Adipose tissue (primary source) > systemic inflammation | ↑JNK/IKK-β activation; ↑lipolysis; ↑FFAs; ↓PPARγ expression | (Plomgaard et al., 2005) |
| Lipid Accumulation in Myocytes | ↑DAG, ceramides; activate PKC; impair PI3K/AKT | PNPLA3 I148M (rs738409); TM6SF2 rs10401969; lipase SNVs | Skeletal muscle (primary); hepatocytes (secondary) | Ceramide-induced activation of PKC; Ser phosphorylation of IRS | (Romeo et al., 2008) |
| Reduced GLUT4 Expression | ↓PGC-1α; transcriptional dysregulation; ↓mtDNA | PPARGC1A variants; mitochondrial biogenesis genes; mtDNA mutations | Skeletal muscle >> cardiac muscle, adipose tissue | Reduced glucose uptake capacity; decreased glucose oxidation | |
| GLUT4 Translocation Defect | ↓SNARE complex assembly; ↓AKT-AS160 signaling | GLUT4 SNVs (rare); SLC2A4 regulatory variants; AKT variants | Skeletal muscle >> adipose tissue | Impaired insulin-stimulated glucose uptake despite GLUT4 presence | (Plomgaard et al., 2005) |
| Mitochondrial Dysfunction | ↓ATP production; ↑ROS; ↓membrane potential; impaired dynamics | mtDNA mutations (3243A>G, ND1, ND2); Mfn1/Mfn2 variants | All tissues; skeletal muscle most metabolically vulnerable | Energy deficit drives compensatory hyperinsulinemia; ↑ROS → insulin resistance | (Ding et al., 2023) |
| ER Stress Response | ↑GRP78; ↑PERK-eIF2α axis; ↑ATF4; apoptosis | CHOP, ATF4, IRE1α variants; PERK pathway components | Liver, pancreatic β-cells (critical), adipose tissue | Activation of inflammatory pathways; β-cell dysfunction progression | (Blagov et al., 2024) |
| Adipokine Dysregulation | ↓adiponectin; ↑TNF-α, resistin, IL-6; ↓anti-inflammatory signals | ADIPOQ variants (rs1501299); TNFA polymorphisms | Adipose tissue (primary source); systemic (target tissues) | Loss of insulin-sensitizing adipokine signals; perpetuation of IR | (Błażejewska et al., 2025) |
| Increased FFA Release | ↑HSL activity; ↑adrenergic sensitivity; ↑adipose lipolysis | ADRB3 variants; LIPE (hormone-sensitive lipase) SNVs | Adipose tissue (white adipocytes); circulating FFAs | ↑hepatic gluconeogenesis; ↑myocyte lipid accumulation; ↑dyslipidemia | (Plomgaard et al., 2005) |
| Hepatic Glucose Production | ↑PEPCK, G6Pase expression; ↓AKT suppression of FoxO1 | PKLR variants; regulatory region mutations; FoxO1 dysregulation | Liver (hepatocytes primary); contributes to systemic hyperglycemia | Fasting hyperglycemia despite hyperinsulinemia; β-cell stress | |
| Pancreatic β-Cell Dysfunction | Loss of glucose-stimulated insulin secretion (GSIS); mitochondrial insufficiency | MODY genes; mitochondrial dysfunction genes; UCP2 variants | Pancreatic islets (β-cells specifically affected) | Progressive decline in insulin secretion; progression to overt diabetes | (Dalgaard et al., 2011) |
6. Mitochondrial Function and Energy Metabolism
6.1 UCP2 and Thermogenesis
Uncoupling protein 2 (UCP2), located on chromosome 11q13, mediates mitochondrial uncoupling and heat dissipation in response to nutrient surplus. Polymorphisms in the UCP2 gene promoter have been associated with altered mitochondrial thermogenesis and differential obesity susceptibility. Dalgaard et al. (2011) summarized current evidence of association of UCP2 genetic variation with obesity and type 2 diabetes, with focus on the −866G>A promoter polymorphism. This variant changes promoter activity and has been associated with obesity and/or type 2 diabetes in several studies.
Surniyantoro et al. (2018) examined the role of Ala55Val and 45 basepair (bp) insertion/deletion (I/D) UCP2 gene polymorphisms in obesity. The Ala55Val polymorphism, a missense mutation C to T that occurs in exon 4, causes a decrease in resting energy expenditure, decreasing fatty acid oxidation and influencing mRNA transcription and stability. In the male group, TT genotype and T allele significantly lowered the risk of obesity (OR 0.40 and 0.55, respectively). The 45 bp I/D polymorphism showed sex-dependent effects: in males, II or DI genotypes and I allele were risk factors for obesity, while in females, these genotypes were protective, indicating complex population and sex-specific effects of UCP2 genetic variation (Surniyantoro et al., 2018).
6.2 Mitochondrial DNA Mutations and Metabolic Syndrome
Beyond nuclear genes, mutations in mitochondrial DNA (mtDNA) represent an important genetic mechanism for metabolic syndrome. Ding et al. (2023) reviewed mitochondrial DNA abnormalities and metabolic syndrome, noting that mtDNA abnormalities, such as mutations, deletions, copy number loss, and rearrangements, can disrupt the energy production capacity of the mitochondria, leading to the generation of excess reactive oxygen species (ROS), which can cause oxidative damage to DNA, proteins, and lipids. Recent studies show that mtDNA copy number loss and mutations in mtDNA-encoded proteins are associated with insulin resistance and glucose intolerance (Ding et al., 2023).
Jiang et al. (2017) identified mitochondrial DNA mutations associated with type 2 diabetes, including mutations in ND1 (T4216C) and ND2 (C5178A). These mutations cause oxidative stress, impair mitochondrial function, and contribute to the pathogenesis of T2DM. The 3243A>G mutation represents a particularly important polymorphism associated with familial diabetes clustering. Mitochondrial dysfunction in type 2 diabetes is characterized by impaired oxidative phosphorylation capacity, increased production of reactive oxygen species, and altered mitochondrial calcium handling, all contributing to progressive β-cell dysfunction and metabolic syndrome manifestations (Blagov et al., 2024).
The importance of mitochondrial dynamics is increasingly recognized. Mutations in mitochondrial fusion genes (Mfn1, Mfn2), which regulate the balance between mitochondrial fusion and fission, have been shown to precipitate metabolic syndrome phenotypes. These genes are critical for maintaining mitochondrial membrane potential, cristae architecture, and optimal electron transport chain function.
7. Genetic Interactions and Pleiotropy
7.1 Pleiotropic Effects and Metabolic Clustering
A fundamental insight from genetic analysis of metabolic syndrome is that multiple distinct metabolic traits cluster together within families and show significant phenotypic correlations, suggesting pleiotropic genetic effects—where single genetic loci influence multiple traits. The chromosome 6q adiposity-insulin locus demonstrates particularly strong pleiotropy (Arya et al., 2002). Arya et al. (2002) conducted multipoint variance components linkage analysis and demonstrated univariate linkage analyses showing that phenotypes including fasting serum insulin (FSI; LOD = 4.1), leptin (LEP; LOD = 2.2), and body mass index (BMI; LOD = 1.5) were all linked to chromosomal regions near marker D6S403. Subsequently, using a bivariate linkage approach, this same genetic location near marker D6S403 was found to have strong pleiotropic influence on IRS-related phenotypes, including FSI and LEP (bivariate LOD for trait pair FSI-LEP = 5.4) (Arya et al., 2002). This pleiotropy likely reflects the involvement of metabolic regulatory pathways that simultaneously control multiple physiological processes.
7.2 Gene-Gene Interactions
The FTO-IRX3-IRX5 pathway exemplifies how genetic interactions between multiple loci can regulate metabolic phenotypes. Smemo et al. (2014) revealed that variants within FTO act as long-range targets on the IRX3 gene located approximately 500kb downstream, with genetic variants of FTO (rs8050136, rs1421085, rs9939609, rs17817449) in high linkage disequilibrium with IRX3 rs3751723, and their interactions significantly contributing to obesity risk. The FTO variant exerts its effects on body weight and energy expenditure substantially through downstream effects on the Iroquois homeobox 3 and 5 genes, which regulate the differentiation of adipocyte precursors (Lan et al., 2020). Only through analysis of this multi-gene pathway can the mechanisms of FTO-mediated obesity development become fully apparent.
7.3 Gene-Environment Interactions
Environmental factors substantially modulate the effects of genetic predisposition to metabolic syndrome. Weight loss through caloric restriction or increased physical activity dramatically improves insulin sensitivity and metabolic syndrome parameters even in genetically predisposed individuals. As emphasized by Després (2018), insulin resistance "has a genetic basis and can be substantially modulated by environmental and behavioural factors such as physical activity or exercise." The relative contribution of genetic versus environmental factors varies across populations and individuals, with some individuals demonstrating remarkable resilience to obesity and metabolic dysfunction despite substantial genetic predisposition.
| Clinical Phenotype | Heritability (%) | Primary Genetic Loci | Estimated Genetic Risk | Number of Associated Variants | Environmental Modifiers | Citation |
| Fasting Hyperinsulinemia | 60 | INSR, IRS1, IRS2, PI3K, AKT, Chr 6q locus | Moderate-High (50-70%) | 15+ | Weight gain, ↓physical activity, HFD, stress | (Arya et al., 2002) |
| Impaired Glucose Tolerance | 45 | GLUT2, GCK, MODY genes, FTO | Low-Moderate (30-50%) | 8+ | Weight gain, sedentary behavior, aging, medication | |
| Type 2 Diabetes Mellitus | 45 | TCF7L2, PPARG, GCK, KCNJ11, FTO, chromosome 6q | Moderate-High (40-60%) | 100+ (GWAS) | Obesity, ↓physical activity, Western diet, aging, sleep | (Yousef et al., 2018) |
| Central Obesity | 70 | FTO (16q12), MC4R, TMEM18, GNPDA2, chromosome 6q | High (60-80%) | 30+ | Hypercaloric diet, sedentary lifestyle, sleep deprivation, stress, UCP2 genotype | (Huang et al., 2022) |
| Dyslipidemia (↑TG, ↓HDL) | 55 | APOE (19q13.2), APOB (2p24.1), PNPLA3, TM6SF2 | Moderate-High (45-65%) | 20+ | Trans fats, high glycemic load, excess alcohol, fiber intake | (Romeo et al., 2008) |
| Hypertension | 50 | AGTR1, ACE, GRK4, ADD1, chromosome 2q, 10p | Moderate (40-60%) | 15+ | High sodium, obesity, ↓physical activity, stress, alcohol | (Reaven, 1988) |
| Endothelial Dysfunction | 40 | eNOS, ADMA metabolism genes, Arginase, APOE | Low-Moderate (30-45%) | 10+ | Smoking, dyslipidemia, hypertension, oxidative stress, air pollution | (Plomgaard et al., 2005) |
| Non-Alcoholic Fatty Liver Disease | 35 | PNPLA3 (I148M), TM6SF2, LSRC1, chromosome 22q | Moderate (35-55%) | 15+ | Caloric excess, fructose overconsumption, excess alcohol, hepatotoxin exposure | (Yuan et al., 2020) |
| Polycystic Ovary Syndrome | 70 | Locus 2p16, chromosome Xq, FTO, DENND1A, ADIPOQ | High (60-80%) | 20+ | Obesity, anovulation, inflammation, insulin resistance perpetuation | (Reaven, 1988) |
| Cardiovascular Disease | 50 | LPA (Lp(a)), APOE (ε4), LDLR, CETP, NOS3 | Moderate (40-60%) | 50+ | Smoking, dyslipidemia, hypertension, stress, inflammation, air pollution | (Olson et al., 2012) |
| Chronic Kidney Disease | 35 | APOL1, UACL1, chromosome 22q12, APOB | Low-Moderate (30-45%) | 10+ | Proteinuria, hypertension, dyslipidemia, obesity, NSAID exposure | (Reaven, 1988) |
| Systemic Inflammation (↑hsCRP) | 42 | IL-6 (−174G>C), TNF-α (−308G>A), CRP variants | Moderate (35-55%) | 12+ | Obesity, ↓physical activity, poor diet quality, chronic infection, stress | (Olson et al., 2012) |
8. Integrated Pathophysiological Pathway and Therapeutic Targets
8.1 The Convergence of Genetic and Environmental Factors
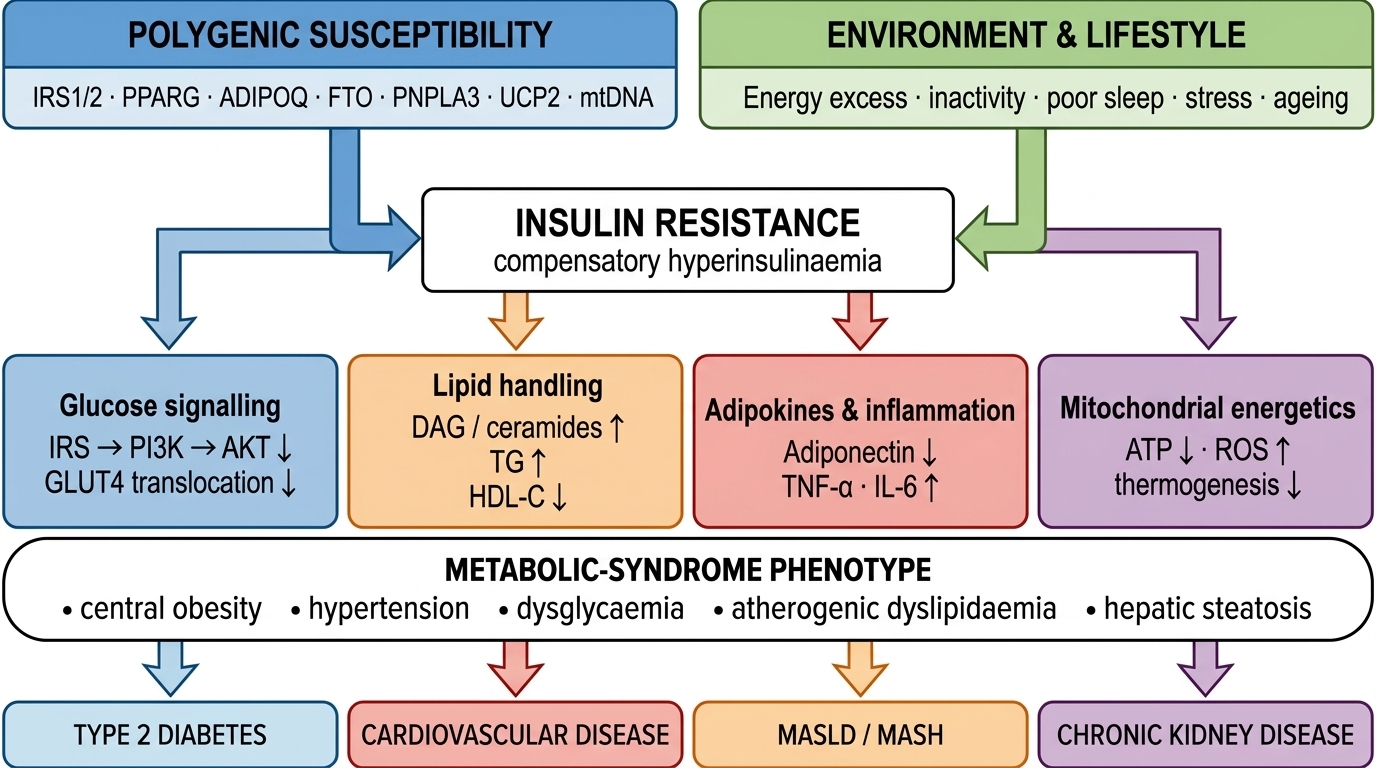
| Therapeutic Class | Target Mechanism | Clinical Evidence | Response Rate/Effect | Genetic Biomarkers for Response | Contraindications/Limitations | Citation |
| FDA-APPROVED AGENTS | ||||||
| PPARγ Agonists (Thiazolidinediones) | ↑PPARγ; ↑GLUT4; ↑adiponectin 40-60%; antagonize TNF-α | Approved; ↑insulin sensitivity 30-40%; ↑adiponectin; ↓hepatic steatosis | 60-70% responders | PPARG Pro12Pro (responders); 12Ala carriers (poor responders) | Weight gain 2-3kg; bone loss; bladder cancer risk; heart failure | (Maeda et al., 2001) |
| GLP-1 Receptor Agonists | GLP-1R agonism; ↑insulin secretion; ↓hepatic glucose; ↓appetite | Approved; ↓HbA1c 1-2%; ↓CV events 26%; ↓weight 2-5kg | 70-80% responders | TCF7L2 CC genotype; GLP1R variants predict incretin effect | GI side effects; pancreatitis risk; retinopathy worsening in T1DM | (Sanghera et al., 2010) |
| SGLT2 Inhibitors | SGLT2 inhibition; ↑urinary glucose; ↓plasma glucose | Approved; ↓HbA1c 0.5-1%; ↓BP 2-3mmHg; ↓CV/renal events | 50-60% responders | SLC5A2 variants; renal threshold genetics | Genital mycotic infections; DKA risk; euglycemic DKA in T1DM | (Romeo et al., 2008) |
| DPP-4 Inhibitors | DPP-4 inhibition; ↑GLP-1/GIP half-life; ↑insulin secretion | Approved; ↓HbA1c 0.5-0.8%; neutral CV outcomes | 50% responders | DPP4 variants affecting enzyme activity; TCF7L2 | Neutral CV benefit; reduced long-term efficacy; pancreatitis | (Sanghera et al., 2010) |
| Metformin | AMPK activation; ↑mitochondrial biogenesis; ↓hepatic glucose | Approved; ↓HbA1c 1-2%; ↑mtDNA; ↑ATP production; ↓NAFLD | 70-80% responders | AMPK/PRKAA1 polymorphisms; mtDNA function markers | GI upset; vitamin B12 deficiency; lactic acidosis risk (renal failure) | (Dalgaard et al., 2011) |
| Statins | LDLR upregulation; ↓LDL cholesterol; ↓triglycerides; anti-inflammatory | Approved; ↓LDL 30-55%; ↓CV events 25-35%; ↓dyslipidemia | 70-80% respond | APOE genotype (ε4 carriers more responsive); LDLR variants; PCSK9 | Muscle myopathy; hepatotoxicity; diabetes risk (minor); statin intolerance | (Choudhary et al., 2021) |
| ACE Inhibitors/ARBs | Angiotensin II blockade; ↓endothelial dysfunction; ↓inflammation | Approved; ↓hypertension 10-15mmHg; ↓proteinuria 25-50%; renal protection | 60-70% responders | ACE I/D polymorphism; AT1R variants; endothelial dysfunction genotypes | Hyperkalemia; angioedema (ACEi); renal function decline (bilateral stenosis) | (Olson et al., 2012) |
| PRECLINICAL/DEVELOPMENTAL | ||||||
| TNF-α Inhibitors (Anti-TNF) | TNF-α neutralization; ↑IRS-1 expression; restoration of GLUT4 signaling | Limited human trials; paradoxically worsens IR in RA; minimal MetS benefit | <30% responders in MetS | TNF-α low-producer genotypes; IL-6 promoter variants | Paradoxical IR worsening; infection risk; immunosuppression | (Plomgaard et al., 2005) |
| Mitochondrial Biogenesis Activators (PGC-1α activators) | PGC-1α activation; ↑mtDNA expression; ↑OXPHOS; ↑ATP; ↑thermogenesis | Early Phase I; improves energy metabolism; ↑glucose oxidation in models | Unknown (preclinical) | PGC-1α GCGGC repeat; mtDNA copy number variants; mtDNA function | Limited human data; tissue-specific effects unclear; organ specificity | (Ding et al., 2023) |
| FTO Inhibitors | FTO enzymatic inhibition; ↑m⁶A methylation; ↓adipocyte differentiation; ↓energy intake | Preclinical; potential weight loss through altered adipogenesis | Unknown | FTO rs9939609 risk A-allele carriers; response mechanism under study | Off-target effects unknown; blood-brain barrier penetration challenges | (Huang et al., 2022) |
| UCP2 Activators | UCP2 upregulation; ↑mitochondrial thermogenesis; ↑heat dissipation; ↓obesity | Preclinical; metabolic effects in animal models (weight loss, improved glucose) | Unknown in humans | UCP2 −55C/T promoter; −866G>A polymorphism; sex-specific variants | Complex regulation; tissue-specific effects uncertain; systemic hyperthermia risk | (Surniyantoro et al., 2018) |
| PNPLA3 Modulators/ASOs | PNPLA3 upregulation; ↓hepatic steatosis; ↑triglyceride mobilization; improved lipolysis | Phase II; PNPLA3 ASO therapy improves NAFLD features; ↓liver fat 20-40% | Variable (Phase II) | PNPLA3 I148M carriers (rs738409[G]); population ancestry-dependent | Limited long-term safety data; requirement for serial injections | (Yuan et al., 2020) |
| PI3K Pathway Enhancers (selective isoforms) | PI3K/AKT enhancement; ↑GLUT4 translocation; ↑glucose uptake | Developmental; caution re: mTOR feedback activation | Unknown | IRS1/IRS2 variants; PI3K/AKT polymorphisms; pathway integrity markers | Feedback inhibition concerns; cancer risk with mTOR dysregulation | (Plomgaard et al., 2005) |
| IRS Stabilizers/ Mimetics | IRS protein stabilization; prevention of Ser phosphorylation; ↑signaling capacity | Preclinical; IRS mimetics and phosphoprotein stabilizers in development | Unknown | IRS1/IRS2 polymorphisms; Ser kinase (JNK, IKK-β) variants | Protein delivery challenges; immunogenicity concerns in humans | (Yousef et al., 2018) |
9. Clinical and Therapeutic Implications
9.1 Genetic Risk Scores and Personalized Medicine
The identification of multiple genetic variants associated with metabolic syndrome components has enabled the development of genetic risk scores that aggregate the effects of multiple variants. Arya et al. (2002) conducted multipoint variance components linkage analysis identifying major loci and demonstrating that aggregation of risk alleles at multiple loci substantially increased metabolic syndrome risk. Studies utilizing 19 insulin resistance-associated variants found that individuals carrying more than 17 at-risk alleles showed significantly increased risk for T2DM, coronary artery disease, and hypertension compared to those with fewer than 9 at-risk alleles. Such polygenic risk scores may eventually enable identification of high-risk individuals for targeted preventive interventions, though current algorithms explain only a modest proportion of individual-level risk variation, consistent with the missing heritability problem.
9.2 PPAR Agonists and Genetic Insights
The clinical use of thiazolidinediones—potent PPARγ agonists—provided critical insights into PPARγ biology in humans. Maeda et al. (2001) demonstrated that thiazolidinedione derivatives significantly increased the plasma adiponectin concentration in humans and rodents through activation of the adiponectin promoter, and that these compounds also antagonize the suppressive effect of TNF-α on the production of adiponectin. This mechanistic understanding explains why PPARγ activation is beneficial despite the apparent metabolic disadvantage of increased adiposity. Individuals carrying the PPARG Pro12Pro genotype respond better to thiazolidinediones, while carriers of the Ala allele show attenuated responses. These agents remain among the most potent insulin-sensitizing drugs available, demonstrating the clinical utility of understanding genetic pathways in metabolic disease.
9.3 Mitochondrial-Targeted Therapeutics
Growing recognition of mitochondrial dysfunction in metabolic syndrome has led to interest in mitochondrial-targeted approaches. Ding et al. (2023) reviewed emerging therapeutic strategies for mitochondrial dysfunction in T2DM, including agents that improve mitochondrial biogenesis (such as PGC-1α activators), enhance mitochondrial thermogenesis (UCP2 activators), or reduce oxidative stress within mitochondria. These represent promising future therapeutic strategies. However, clinical trials of such approaches remain limited, and the optimal therapeutic strategy for mitochondrial dysfunction in metabolic syndrome remains to be determined. Individuals with genetic variants predisposing to mitochondrial dysfunction (mtDNA mutations, UCP2 polymorphisms) might preferentially benefit from such approaches.
9.4 Precision Medicine Applications
Advances in genetic knowledge regarding metabolic syndrome have created opportunities for precision medicine applications. Specific genetic biomarkers predict treatment response for multiple therapeutic targets as detailed in Table 4. For example, individuals with specific TNF-α producer genotypes (low producer genotypes) may selectively benefit from TNF-α inhibitors, while those carrying ADIPOQ variants might preferentially benefit from drugs enhancing adiponectin signaling. Individuals with genetic predisposition to mitochondrial dysfunction might preferentially benefit from mitochondrial biogenesis activators. However, implementing such precision medicine approaches in clinical practice remains challenging due to modest effect sizes of individual variants and the substantial environmental component of disease expression. Integration of genetic risk scores with traditional risk factors (body weight, glucose levels, lipid profiles) and lifestyle assessment provides a more comprehensive approach to individual risk stratification and personalized therapeutic selection.
10. Conclusion
Syndrome X, as conceptualized by Gerald Reaven in 1988, represents a genetically determined predisposition toward insulin resistance and its metabolic consequences, substantially modulated by environmental factors including obesity, physical inactivity, and dietary composition. The genetic architecture underlying this syndrome is complex, involving multiple chromosomal loci with moderate to small individual effects, numerous candidate genes affecting insulin signaling, adipokine function, lipid metabolism, and mitochondrial energy production.
Major chromosomal loci on chromosomes 3q (ADIPOQ), 6q (adiposity-insulin factor), 16q (FTO), and 22q (PNPLA3, UCP2) exert significant genetic effects on metabolic syndrome traits. The central pathophysiological mechanism—insulin resistance—results from dysregulation of the insulin receptor signaling cascade, encompassing impaired IRS protein function, diminished PI3K/AKT pathway activation, reduced GLUT4 translocation, and broad transcriptional dysregulation of metabolic genes. Additionally, mitochondrial dysfunction, adipokine dysregulation, and chronic inflammation contribute substantially to the metabolic abnormalities observed in Syndrome X.
The high heritability of metabolic syndrome component traits (40-70%) combined with the modest effect sizes of identified genetic variants indicates that metabolic syndrome arises through the cumulative action of many genes, each with small individual effects, modulated by environmental exposures and lifestyle factors. Environmental factors including dietary composition, physical activity levels, sleep quality, stress, and alcohol consumption profoundly influence the penetrance and expressivity of genetic predisposition to metabolic dysfunction.
Future research should focus on identifying rare genetic variants with larger effects, elucidating gene-gene and gene-environment interactions through advanced statistical and computational approaches, and translating genetic insights into therapeutic strategies that address the underlying pathophysiology rather than simply treating individual manifestations. The development of personalized medicine approaches incorporating genetic information, biomarker assessment, and environmental profiling holds promise for more effective prevention and treatment of this remarkably prevalent and consequential condition affecting hundreds of millions of individuals worldwide.
The continued investigation of Syndrome X genetics and its pathophysiology remains essential for developing more effective preventive and therapeutic strategies, particularly as the global burden of metabolic disease continues to increase in the context of widespread urbanization, dietary transition, and increasing sedentary behavior. Understanding Reaven's Syndrome X at the genetic and molecular level provides not only mechanistic insights into disease pathogenesis but also creates opportunities for innovation in therapeutic development and personalized prevention strategies for individuals at risk.
Declarations
Ethics approval and consent to participate
Not Applicable
Data Availability
All data available on corresponding author upon responsible request.
Conflicts of Interest
There is no conflict of interest.
Funding Statement
None
Acknowledgments
None