Introduction
End-stage renal disease (ESRD) represents the final stage of chronic kidney disease and continues to impose a substantial global health burden because of its high morbidity, mortality, and economic impact. Progressive loss of renal function is accompanied by widespread systemic disturbances, including profound alterations in hematological and hemostatic homeostasis that contribute to adverse clinical outcomes [1,2]. Among these abnormalities, platelet dysfunction is considered an important factor underlying the coexistence of both bleeding complications and thrombotic events in patients with advanced renal failure [3].
Platelets play a central role in primary hemostasis, and abnormalities affecting both platelet number and function have been widely reported in ESRD. While thrombocytopenia may develop in a subset of patients, qualitative abnormalities seem to be more clinically significant than platelet count alone [4,5]. Accumulation of uremic toxins, chronic inflammation, oxidative stress, and endothelial injury all affect platelet generation, activity, and shape, causing detectable alterations in platelet indices [6].
The introduction of modern automated hematology analyzers has expanded the range of platelet parameters available for routine clinical practice. Indices such as mean platelet volume (MPV), platelet-large cell ratio (PLCR), plateletcrit (PCT), immature platelet fraction (IPF), and platelet-large cell count (PLCC) provide indirect information about platelet size, production, and turnover [7,8]. Growing evidence suggests that these readily available parameters may serve as practical biomarkers of platelet kinetics and bone marrow activity in several chronic diseases, including chronic kidney disease [9].
Despite increasing interest in platelet indices, information from low-resource settings remains limited. Most published studies have originated from high-income countries where patient demographics, healthcare systems, and disease characteristics differ substantially from those encountered in sub-Saharan Africa [10]. In Eastern Sudan, where the burden of chronic kidney disease continues to rise and access to specialized investigations is often restricted, inexpensive laboratory markers that improve disease characterization are of particular value.
Previous investigations have generally focused on individual platelet indices rather than evaluating the overall pattern of platelet alterations in ESRD. Furthermore, little is known about how these changes relate to markers of renal dysfunction, including proteinuria and declining kidney function, in African populations. We therefore hypothesized that ESRD is associated with a characteristic profile of platelet index abnormalities, consisting of increased MPV and IPF together with reduced PLCR and PLCC, and that these changes would parallel the severity of renal impairment.
To our knowledge, this is among the first studies from Sudan to examine an extended panel of platelet indices, including IPF and PLCC, in patients receiving maintenance hemodialysis. By combining conventional statistical comparisons with multivariable logistic regression and ROC analysis, this study provides a broader assessment of platelet abnormalities than platelet count alone and explores their potential clinical value in a resource-limited setting.
Materials and Methods
Study Design and Setting
This hospital-based analytical case-control study was carried out at Port Sudan Teaching Hospital, a major referral center providing surgical, nephrology, and maintenance hemodialysis services in Eastern Sudan. Recruitment was conducted between June and December 2024.
Study Population
The study involved 140 participants, 70 adults with proven ESRD on regular maintenance hemodialysis and 70 apparently healthy controls.
Eligibility required patients to be at least 18 years old and have a verified diagnosis of ESRD requiring continuous hemodialysis, as defined by approved clinical and laboratory criteria.
Controls were selected from hospital employees and patient families. To provide an acceptable comparison group, patients with known renal disease, acute or chronic inflammatory disorders, hematological diseases, or abnormal renal function test findings were eliminated.
Exclusion Criteria
Participants were excluded if they had conditions likely to influence platelet function or hematological parameters, including active infection, inflammatory disease, hematological disorders, or malignancy. Individuals who had received blood transfusions within the previous three months were also excluded to avoid transient hematological changes.
Patients receiving chronic anticoagulants or antiplatelet therapy were not eligible for inclusion. Routine unfractionated heparin administered during hemodialysis was not considered an exclusion criterion because it formed part of standard dialysis management.
Data Collection
Demographic and clinical information, including age, sex, and relevant medical history, was collected using a structured pretested questionnaire. Additional clinical details, including ESRD diagnosis, dialysis duration, and treatment characteristics, were verified through review of medical records.
Eligible participants were enrolled consecutively until the predetermined sample size was reached. Controls were recruited using the same approach as for hospital staff and accompanying relatives who met the eligibility criteria.
Blood Collection and Laboratory Analysis
Venous blood samples were collected from hemodialysis patients just before the dialysis session and shortly before the intradialytic heparin injection to minimize the effects of the technique on platelet values. All specimens were handled within 1 hour of collection.
Five mL of venous blood was taken in a sterile manner. For hematological examinations, blood samples were collected in EDTA tubes, and for biochemical analysis, in lithium-heparin tubes.
Complete blood count and platelet parameters were measured with a DYMIND DH-800 automated six-part hematology analyzer (Dymind, China) according to the manufacturer’s guidelines. The platelet indices assessed were platelet count (PLT), mean platelet volume (MPV), platelet distribution width (PDW), platelet distribution width-standard deviation (PDWsd), plateletcrit (PCT), platelet-large cell ratio (PLCR), immature platelet fraction (IPF), and platelet-large cell count (PLCC).
PLCR is the percentage of circulating platelets greater than 12 fL, and PLCC is the absolute quantity of circulating platelets larger than 12 fL. IPF was utilized as a marker of thrombopoietic activity, reflecting newly released RNA-containing platelets.
Renal biochemical parameters such as serum urea, blood urea nitrogen, creatinine, urine microalbumin, and protein-to-creatinine ratio were measured on a Mindray BS-230 automated chemistry analyzer with the manufacturer’s reagents. Estimated glomerular filtration rate (eGFR) was estimated by the CKD-EPI equation.
All laboratory procedures were carried out according to normal operating protocols, and routine calibration and internal quality-control procedures were completed over the study period.
Definitions
Platelet count <150,000/µL was considered thrombocytopenia in accordance with the standard hematological criteria [11]. This threshold is recognized in clinical hematology as a platelet mass decline which may lead to hemorrhage.
CKD stage 5 is ESRD [12] according to the National Kidney Foundation-Kidney Disease Outcomes Quality Initiative (NKF-KDOQI). In CKD stage 5, an estimated glomerular filtration rate (eGFR) < 15 mL/min/1.73 m2 implies irreversible kidney failure requiring hemodialysis or kidney transplantation.
Statistical Analysis
Statistical analyses were performed using IBM SPSS Statistics version 27 (IBM Corp., Armonk, NY, USA). Data distribution was evaluated using the Shapiro-Wilk test. Normally distributed variables are presented as mean ± standard deviation, whereas skewed variables are reported as median and interquartile range.
Comparisons between groups were performed using the independent-samples t test or the Mann-Whitney U test as appropriate. Categorical variables were evaluated by Pearson’s χ2 test or Fisher’s exact test.
Correlations between platelet indices and renal parameters were analyzed by Spearman rank correlation coefficient. Multivariable logistic regression was performed to identify variables independently linked with ESRD, adjusted for age and sex.
Receiver operating characteristic (ROC) curve analysis was done to assess the discriminatory power of platelet indices. Area under the curve (AUC) and optimal cut-off values of the Youden index, sensitivity, specificity, and 95% confidence intervals were estimated. Statistical significance was defined as a two-sided p-value < 0.05.
Ethical considerations
The Research Ethics Committee of Port Sudan Ahlia University granted ethical approval for the project (REC-PAU 21/09, approval date 5/3/2024). Informed written consent was acquired from all individuals before their inclusion in the study. All procedures were performed in compliance with the ethical requirements of the institutional research committee and the principles outlined in the Declaration of Helsinki.
Results
Baseline Characteristics of the Study Population
A total of 140 participants were included in this study, comprising 70 patients with end-stage renal disease (ESRD) and 70 apparently healthy controls. The median age of patients in the ESRD and control groups was 50.0 years (IQR 42.5–62.8) and 50.0 years (IQR 39.3–67.8), respectively (p = 0.703). The mean age was 51.1 ± 13.6 years in patients with ESRD and 52.8 ± 15.4 years in controls. The sex distribution did not differ statistically between groups, with 80.0% (56/70) of ESRD patients and 75.7% (53/70) of controls being male (χ² = 0.17, p = 0.684).
On the other hand, Anemia was substantially higher among ESRD patients (72.9%, 51/70) than among controls (8.6%, 6/70) (χ2 = 55.3, p < 0.001). There were no significant differences in leukocyte counts between the two groups. The median white blood cell count was 5000 cells/μL (IQR: 4125–6300) in ESRD patients and 5050 cells/μL (IQR: 4025–6275) in controls (p = 0.889). Thrombocytopenia was more frequent in ESRD patients than in controls, but the difference was not statistically significant. Thrombocytopenia was present in 14.3% (10/70) of ESRD patients and 8.6% (6/70) of controls (χ2 = 1.13, p = 0.288). Thrombocytopenia was more common in ESRD patients than in controls (OR = 1.78, 95% CI: 0.61–5.19), although the association was not statistically significant (Fisher’s exact test, p = 0.426).
In patients with ESRD, the median duration of dialysis was 29.5 months (interquartile range, 17.25–46.0 months). The median heparin dose administered was 4000 IU (IQR 3250-4000). As for vascular access, 57 patients (81.4%) had an arteriovenous fistula (AVF), 10 patients (14.3%) had a dialysis catheter, and 3 patients (4.3%) had an arteriovenous graft (AVG). Forty-two patients (60.0%) underwent IV iron treatment (100 mg). Erythropoietin (Eprex) was administered at doses of 2000-4000 IU.
Hypertension was the most common underlying illness associated with ESRD, with 42/70 (60.0%) patients having it. ESRD of unknown origin was 22/70 patients (31.4%). Diabetic Nephropathy was identified in 3/70 persons (4.3%). Combined hypertension and diabetes mellitus were also present in 3/70 patients (4.3%). Iron-related parameters were also measured as potential confounders. The median serum ferritin level was 346.25 ng/Ml (IQR: 321.25–419.93), median serum iron was 85.70 µg/Dl (IQR: 52.83–131.90), median total iron-binding capacity (TIBC) was 290.10 µg/Dl (IQR: 165.90–369.73), median transferrin saturation was 32.0% (IQR: 17.45–75.78), and median unsaturated iron-binding capacity (UIBC) was 190.20 µg/Dl (IQR: 38.28–306.65).
Platelet Indices
Several platelet indices differed significantly between patients with ESRD and healthy controls (Table 1).
Median platelet count was lower in the ESRD group than in controls (200.0 vs 223.5 ×10⁹/L, p = 0.022). PCT did not differ significantly between ESRD patients and controls. The median PCT was 0.215% (IQR: 0.170–0.250) in the ESRD group and 0.230% (IQR: 0.180–0.280) in controls (p = 0.140).
MPV was substantially greater in ESRD patients (median 10.9 fL [IQR: 10.2–11.65] vs. 10.3 fL [IQR: 9.7–11.28] in controls; p = 0.016). There was no significant difference in PDW between groups. The median PDW was 13.3 (IQR: 12.2-15.0) in ESRD patients, and 13.85 (IQR: 12.33-15.17) in controls (p = 0.602). Also, there was no significant difference in PDWsd between groups. The median PDWsd was 1.446 (IQR: 1.269-1.804) in ESRD patients and 1.432 (IQR: 1.214-1.712) in controls (p = 0.486).
IPF was significantly higher in ESRD patients, with a median of 0.50 (IQR: 0.447–0.622) compared with 0.457 (IQR: 0.385–0.587) in controls (p = 0.024). In contrast, PLCR was significantly reduced in ESRD patients, with a median of 16.95% (IQR: 14.05–20.83) compared with 28.45% (IQR: 24.47–35.28) in controls (p < 0.001). A marked reduction was also observed for PLCC, with median values decreasing from 60.0 ×10⁹/L in controls to 32.0 ×10⁹/L in the ESRD cohort (p < 0.001).
Platelet indices were further compared between ESRD patients with hypertension-related disease (HTR-ESRD, including hypertension alone or combined hypertension and diabetes; n = 45) and those with non-hypertension-related ESRD (non-HTR-ESRD, including unknown etiology or isolated diabetic nephropathy; n = 25). No statistically significant differences were observed between the two subgroups. Median platelet count (PLT) was 196.0 ×10⁹/L (IQR: 176.0–224.0) in HTR-ESRD and 205.0 ×10⁹/L (IQR: 155.0–232.0) in non-HTR ESRD (p = 0.704). Median MPV was 10.9 fL (IQR: 10.2–11.7) in HTR-ESRD and 10.9 fL (IQR: 10.1–11.5) in non-HTR ESRD (p = 0.873). Likewise, PDW, PDWsd, PCT, PLCR, IPF, and PLCC did not differ significantly between the two groups (all p > 0.05). These observations show that the changes in platelet indices reported in the general ESRD group were not mainly attributed to hypertension-related ESRD alone.
Renal Function Parameters
Markers of renal function were significantly different in ESRD patients (Table 2). The median blood urea was substantially higher in the ESRD group (127.5 mg/dL, IQR: 97.0–169.8 mg/dL) than in the control group (26.1 mg/dL, IQR: 23.0–33.0 mg/dL) (p < 0.001). Blood urea nitrogen was also considerably increased in ESRD patients (median 59.58 mg/dL, IQR: 45.33–79.32) compared with controls (median 12.20 mg/dL, IQR: 10.75–15.42; p < 0.001).
Serum creatinine was considerably elevated in the ESRD group with a median of 8.00 mg/dL (IQR: 5.00-9.50) against 0.81 mg/dL (IQR: 0.64-1.00) in controls (p < 0.001). The estimated glomerular filtration rate (eGFR) was significantly lower in ESRD patients (median, 7.22 mL/min/1.73 m²; IQR, 5.44–11.84) compared to controls (median, 107.74 mL/min/1.73 m²; IQR, 80.95–141.30; p < 0.001). ESRD patients had a mean eGFR of 10.42 ± 7.81 mL/min/1.73 m2 compared to 116.46 ± 49.84 mL/min/1.73 m2 in controls.
Microalbuminuria was markedly higher in ESRD patients, with a median urinary microalbumin level of 1003.5 (IQR: 819.8–1132.2) compared with 17.65 (IQR: 13.63–21.05) in controls (p < 0.001). Similarly, the protein–creatinine ratio was substantially elevated in ESRD patients, with a median of 5.17 (IQR: 4.46–5.52) compared with 0.11 (IQR: 0.08–0.13) in controls (p < 0.001).
Regression and Correlation Analysis
To further evaluate whether platelet indices were statistically independently associated with ESRD status, an age- and sex-adjusted multivariable logistic regression analysis was performed (Table 3). After adjustment for age and sex, lower PLT remained independently associated with ESRD (OR 0.61, 95% CI 0.42–0.90; p=0.012), whereas higher MPV was shown to have an independent statistical association with ESRD status (OR = 1.82, 95% CI: 1.17–2.81, p = 0.007). Of the platelet distribution indices, PLCR and PLCC showed the highest statistical connection with ESRD. Reduced PLCR was highly related to ESRD (OR = 0.11, 95% CI: 0.05–0.22, p < 0.0001), and reduced PLCC was similarly strongly inversely associated (OR = 0.057, 95% CI: 0.021–0.151, p < 0.0001). In contrast, PDW, PDWsd, PCT and IPF were not statistically significantly associated with ESRD status after adjusting for age and sex.
As an exploratory analysis, Spearman correlation was performed within the ESRD group to investigate connections between platelet indices and renal parameters. We found the expected associations between markers of renal function, notably inverse associations between eGFR and creatinine, protein–creatinine ratio and microalbuminuria (all p < 0.001), consistent with severe renal failure. Platelet count, as one of the platelet indicators, exhibited significant inverse associations with immature platelet fraction (IPF) (ρ = −0.956, p < 0.001), but mean platelet volume (MPV) linked positively with platelet distribution width standard deviation (PDWsd) (ρ = 0.919, p < 0.001).
Nonetheless, regression studies failed to reveal significant independent correlations between platelet indices and markers of renal severity. Furthermore, due to the exploration of many associations and the mathematical relationships among some variables, these findings should be viewed with caution and regarded as exploratory rather than confirmatory evidence of modified platelet dynamics.
ROC Analysis for Discriminatory Performance
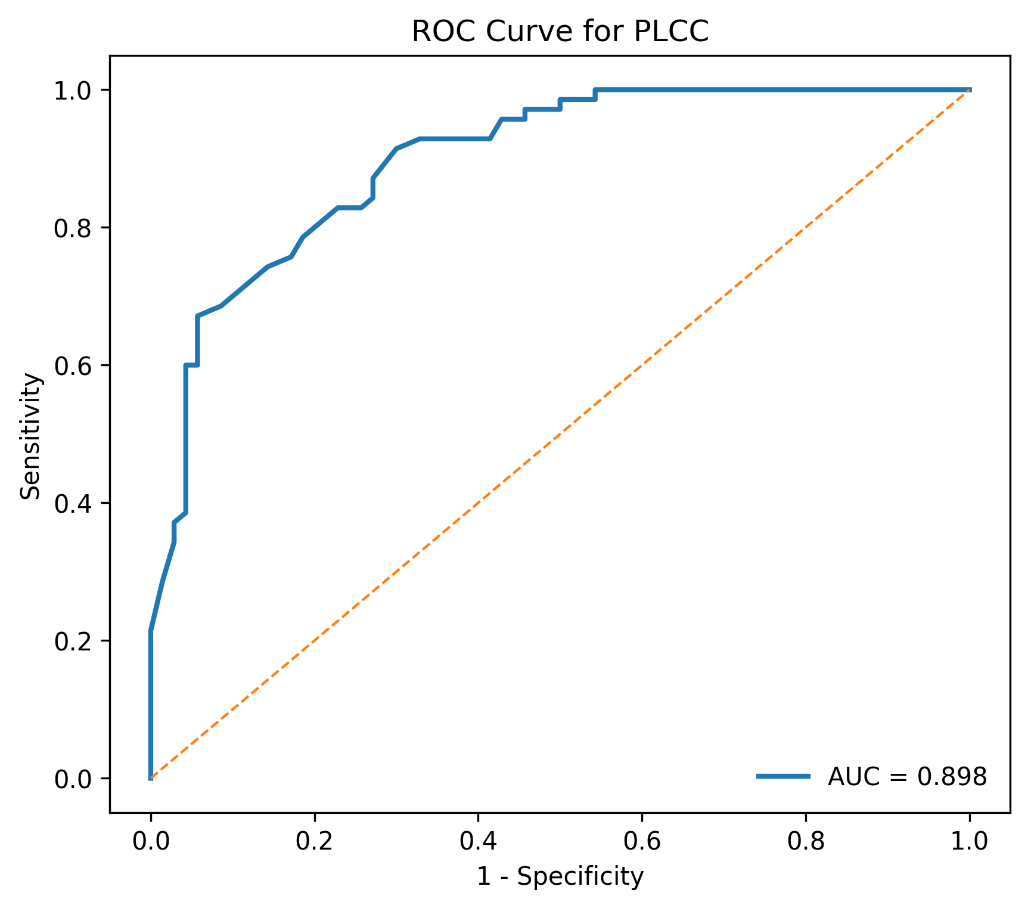
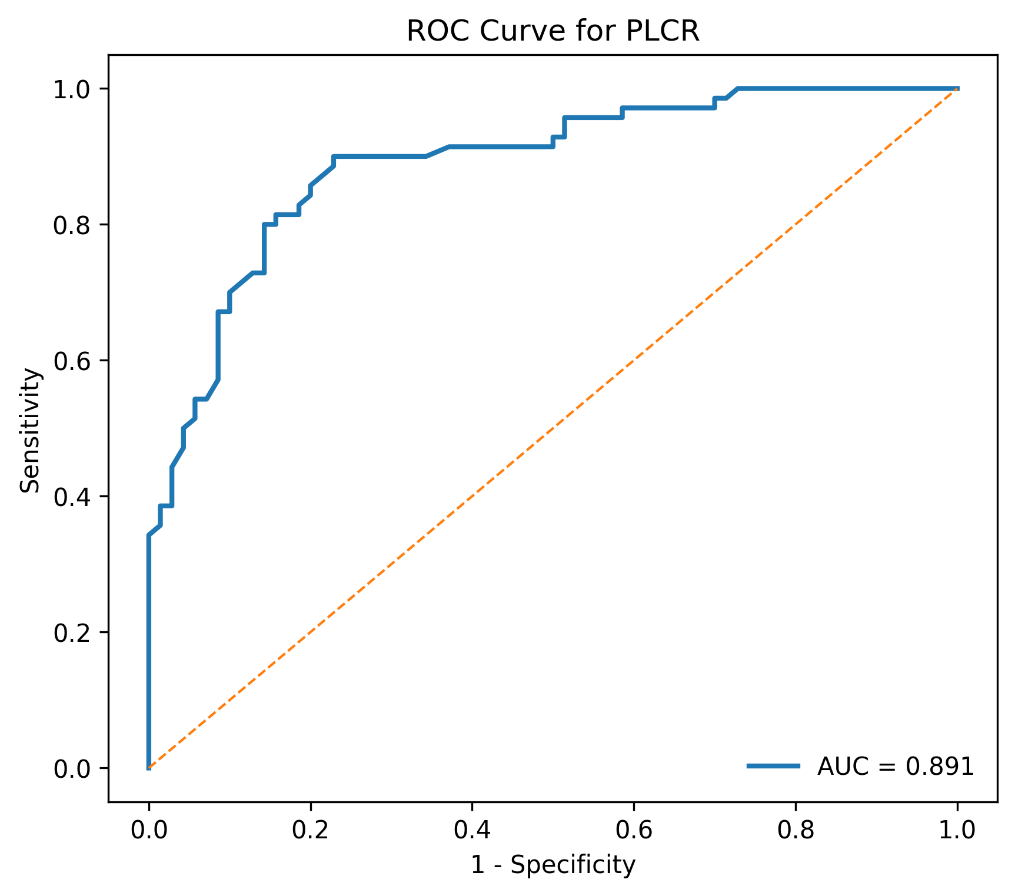
Receiver operating characteristic analysis showed that the most informative platelet markers for discriminating ESRD from controls were PLCC and PLCR. PLCC yielded an area under the curve (AUC) of 0.898, with an optimal cutoff value of 49.0 ×10⁹/L, corresponding to 91.4% sensitivity and 70.0% specificity, with a Youden index of 0.614; this discriminatory performance was highly significant (p < 0.001) (Figure 1). PLCR showed similarly strong performance, with an AUC of 0.891 and an optimal cutoff of 23.9%, yielding 90.0% sensitivity and 77.1% specificity, and a Youden index of 0.671 (p < 0.001) (Figure 2). By comparison, the discriminatory performance of the other platelet indices was modest, with AUC values of 0.618 for MPV (p = 0.013), 0.612 for PLT (p = 0.018), and 0.611 for IPF (p = 0.019) (Table 4).
Among all evaluated platelet indices, PLCC and PLCR demonstrated the greatest ability to distinguish ESRD patients from healthy controls, with AUC values of 0.898 and 0.891, respectively.
| Parameter | ESRD Median (IQR) | Control Median (IQR) | ESRD Mean ± SD | Control Mean ± SD | p-value* |
| Age (years) | 50.0 (42.5–62.8) | 50.0 (39.3–67.8) | 0.703 | ||
| PLT (×10⁹/L) | 200.0 (161.8–224.8) | 223.5 (174.0–260.0) | 197.7 ± 57.4 | 221.3 ± 65.0 | 0.022 |
| MPV (fL) | 10.9 (10.2–11.65) | 10.3 (9.7–11.28) | 11.07 ± 1.66 | 10.43 ± 0.98 | 0.016 |
| PDW (%) | 13.3 (12.2–15.0) | 13.85 (12.33–15.17) | 13.74 ± 2.53 | 15.27 ± 12.14 | 0.602 |
| PDWsd (fL) | 1.446 (1.269–1.804) | 1.432 (1.214–1.712) | 1.54 ± 0.45 | 1.60 ± 1.26 | 0.486 |
| IPF (%) | 0.50 (0.447–0.622) | 0.457 (0.385–0.587) | 0.542 ± 0.159 | 0.491 ± 0.153 | 0.024 |
| PLCR (%) | 16.95 (14.05–20.83) | 28.45 (24.47–35.28) | 17.58 ± 6.21 | 29.40 ± 7.38 | <0.001 |
| PLCC (×10⁹/L) | 32.0 (26.0–40.75) | 60.0 (45.25–80.0) | 33.57 ± 11.51 | 64.71 ± 23.92 | <0.001 |
| PCT (%) | 0.215 (0.170–0.250) | 0.230 (0.180–0.280) | 0.212 ± 0.055 | 0.230 ± 0.068 | 0.140 |
* P-values were calculated using the Mann–Whitney U test. Bold values indicate statistical significance (p < 0.05). PLT, platelet count; PCT, plateletcrit; IPF, immature platelet fraction; MPV, mean platelet volume; PDW, platelet distribution width; PDWsd, platelet distribution width standard deviation; PLCC, platelet large cell count; PLCR, platelet large cell ratio; IQR, interquartile range. SD, standard deviation; ESRD, end-stage renal disease.
| Parameter | ESRD Median (IQR) | Control Median (IQR) | p-value* |
| Blood Urea (mg/dl) | 127.5 (97.0–169.8) | 26.1 (23.0–33.0) | <0.001 |
| BUN (mg/dl) | 59.6 (45.3–79.3) | 12.2 (10.8–15.4) | <0.001 |
| Creatinine (mg/dl) | 8.0 (5.0–9.5) | 0.81 (0.64–1.00) | <0.001 |
| eGFR (ml/min) | 7.22 (5.44–11.84) | 107.74 (80.95–141.30) | <0.001 |
| Microalbumin (mg/l) | 1003.5 (819.8–1132.2) | 17.65 (13.63–21.05) | <0.001 |
| Protein/Creatinine (%) | 5.17 (4.46–5.52) | 0.11 (0.08–0.13) | <0.001 |
* p-values calculated using the Mann–Whitney U test; *Bold values indicate statistically significant differences (p < 0.05).
BUN, blood urea nitrogen; eGFR, estimated glomerular filtration rate; IQR, interquartile range; ESRD, end-stage renal disease.
| Parameter | Adjusted OR per SD | 95% CI | p-value* |
| PLT (×10⁹/L) | 0.61 | 0.42–0.90 | 0.012 |
| MPV (fL) | 1.82 | 1.17–2.81 | 0.007 |
| PDW (%) | 0.74 | 0.35–1.58 | 0.442 |
| PDWsd (fL) | 0.94 | 0.66–1.33 | 0.708 |
| PCT (%) | 0.74 | 0.52–1.05 | 0.094 |
| PLCR (%) | 0.11 | 0.05–0.22 | < 0.0001 |
| IPF (%) | 1.39 | 0.97–1.98 | 0.071 |
| PLCC (×10⁹/L) | 0.057 | 0.021–0.151 | < 0.0001 |
*Bold values indicate Statistical significance, which was defined as p < 0.05. OR, odds ratio; CI, confidence interval; SD, standard deviation; PLT, platelet count; MPV, mean platelet volume; PDW, platelet distribution width; PDWsd, platelet distribution width standard deviation; PCT, plateletcrit; PLCR, platelet-large cell ratio; IPF, immature platelet fraction; PLCC, platelet-large cell count; ESRD, end-stage renal disease.
| Marker | AUC | Cut-off | Sensitivity (%) | Specificity (%) | Youden index | p-value* |
| PLCC (×10⁹/L) | 0.898 | 49.0 | 91.4 | 70.0 | 0.614 | <0.001 |
| PLCR (%) | 0.891 | 23.9 | 90.0 | 77.1 | 0.671 | <0.001 |
| MPV (fL) | 0.618 | 10.7 | 64.3 | 60.0 | 0.243 | 0.013 |
| PLT (×10⁹/L) | 0.612 | 233 | 82.9 | 42.9 | 0.258 | 0.018 |
| IPF (%) | 0.611 | 0.426 | 85.5 | 41.4 | 0.269 | 0.019 |
*Bold values indicate statistically significant differences (p < 0.05). PLT, platelet count; IPF, immature platelet fraction; MPV, mean platelet volume; PLCC, platelet large cell count; PLCR, platelet large cell ratio; AUC, area under the curve.
Discussion
The present study identified a distinct pattern of platelet index abnormalities in patients with ESRD receiving maintenance hemodialysis. Rather than reflecting a simple reduction in platelet number, the observed changes suggest qualitative alterations in platelet biology. This distinction is clinically relevant because abnormalities in platelet function are increasingly recognized as major contributors to the complex hemostatic disturbances associated with advanced kidney disease.
As expected, anemia was considerably more common among patients with ESRD than among healthy controls. This observation is consistent with the well-established pathophysiology of chronic kidney disease, in which impaired erythropoietin production, persistent inflammation, shortened erythrocyte survival, and the toxic effects of retained uremic metabolites collectively suppress erythropoiesis [13,14]. In contrast, leukocyte counts remained comparable between the two groups, suggesting that maintenance hemodialysis itself may not substantially influence baseline leukocyte numbers in clinically stable patients [15]. Thrombocytopenia was more common in the ESRD sample, but the difference was not statistically significant, in line with earlier observations that platelet dysfunction in chronic kidney illness cannot be effectively described by platelet count alone [3,15].
Both MPV and IPF were considerably higher in the ESRD group among the platelet parameters tested. Generally, larger platelets are believed to be more metabolically active, and a raised IPF reflects greater release of freshly produced platelets from the bone marrow [6,9]. The substantial inverse correlation between platelet count and IPF in this study is consistent with a compensatory thrombopoietic response, in which increased platelet synthesis partially offsets increased peripheral platelet consumption or reduced platelet survival [16]. Although this interpretation is biologically reasonable, confirmation will require investigations that include direct assessments of platelet turnover and function.
A very interesting observation was that, even though the MPV went up, the PLCR and PLCC went down. At first look, these data seem contradictory, as a bigger mean platelet volume would be expected to correlate with a larger proportion of large platelets. Several mechanisms may explain this trend. All these parameters may be influenced by repeated exposure to extracorporeal circulation during hemodialysis, changes in platelet size distribution, or technical aspects of automated platelet histogram analysis. Therefore, the observed profile should be considered evidence of altered platelet shape rather than a simple increase in the number of large platelet populations. Additional studies with platelet histograms, flow cytometry, or functional platelet assays might clarify these mechanisms.
Correlation analysis between renal function measures showed predicted connections, indicating the internal coherence of the dataset. Multivariable adjustment did not identify independent relationships between platelet indices and biochemical markers of renal severity. This finding suggests that platelet abnormalities in ESRD are unlikely to be determined solely by declining kidney function. Instead, they probably reflect the combined influence of chronic inflammation, oxidative stress, endothelial dysfunction, repeated hemodialysis exposure, and the accumulation of uremic toxins. Because numerous exploratory correlations were examined, these results should be interpreted cautiously until confirmed in larger prospective studies [17].
The marked deterioration in renal function observed among ESRD patients was reflected by profound elevations in urea, creatinine, microalbuminuria, and protein-to-creatinine ratio, together with a substantial reduction in eGFR. These findings are entirely consistent with advanced chronic kidney disease and support the validity of the study population. The expected inverse relationship between eGFR and proteinuria further strengthens the internal coherence of the clinical data [13].
Among the platelet indices tested, PLCR and PLCC were the most effective and consistent in discriminating ESRD patients from healthy controls. Their AUC values approached 0.90, indicating excellent discriminatory performance within this study population. Although these findings suggest that both indices may have potential value as inexpensive laboratory markers, the results should not be interpreted as evidence of diagnostic accuracy in routine clinical practice because the comparison involved patients with established ESRD and healthy individuals rather than patients presenting with diagnostic uncertainty. External validation in independent cohorts will therefore be essential before these indices can be considered for clinical implementation [18].
From a clinical perspective, the combined reduction in PLCR and PLCC together with increased MPV and IPF illustrates the complex nature of platelet abnormalities in ESRD. This pattern is not isolated thrombocytopenia but also shows concomitant changes in platelet generation, maturation, and size distribution, possibly contributing to the well-known combination of bleeding and thrombotic problems in advanced kidney disease [3,17]. These data highlight the necessity of examining platelet shape and turnover as well as platelet count in the evaluation of hemostatic disorders in this population.
Several strengths add to the value of the present investigation. Firstly, it is one of the most thorough assessments of platelet indices reported from Sudan, including novel parameters like IPF and PLCC in addition to classic platelet assays. Second, all analyses used established laboratory methods including multivariable regression and ROC analysis, which provides a more rigorous assessment than descriptive comparisons alone. Finally, the discovery of PLCR and PLCC as the most informative platelet indices points to their potential utility in future clinical and translational research, especially when access to specialized platelet function testing is limited.
Several limitations should also be considered in light of this investigation's findings. Because of its case-control design, no conclusions on causality can be drawn, and residual confounding cannot be avoided fully, despite correction for age and sex. Selection of controls through convenience sampling may have introduced selection bias. Important clinical variables, including body mass index, smoking status, inflammatory biomarkers, dialysis adequacy, membrane characteristics, residual urine output, and direct measures of platelet activation, were unavailable and therefore could not be incorporated into the analysis. In addition, urinary biomarkers were measured in oliguric patients from limited urine volumes, requiring cautious interpretation. Larger prospective studies integrating platelet function assays and longitudinal follow-up are needed to clarify the biological mechanisms underlying these findings and to determine their clinical significance.
Conclusion
Patients with ESRD demonstrated significant alterations in platelet indices, particularly increased MPV and IPF together with reduced PLCR and PLCC. PLCR and PLCC showed the strongest discriminatory performance between ESRD patients and controls within this study population. Further studies incorporating direct platelet function testing are required to clarify the biological significance of these findings.
Abbreviations
AUC: Area under the curve
AVF: Arteriovenous fistula
AVG: Arteriovenous graft
BUN: Blood urea nitrogen
CBC: Complete blood count
CI: Confidence interval
CKD-EPI: Chronic Kidney Disease Epidemiology Collaboration
eGFR: Estimated glomerular filtration rate
Eprex: Recombinant human erythropoietin
ESRD: End-stage renal disease
IPF: Immature platelet fraction
IQR: Interquartile range
MPV: Mean platelet volume
OR: Odds ratio
PCT: Plateletcrit
PDW: Platelet distribution width
PDWsd: Platelet distribution width standard deviation
PLCC: Platelet-large cell count
PLCR: Platelet-large cell ratio
PLT: Platelet count
REC-PAU: Research Ethics Committee of Port Sudan Ahlia University
ROC: Receiver operating characteristic
SD: Standard deviation
TIBC: Total iron-binding capacity
TSAT: Transferrin saturation
UIBC: Unsaturated iron-binding capacity
Declarations
Ethical Approval and Consent to Participate
Ethical approval for this study was obtained from the Research Ethics Committee of Port Sudan Ahlia University, Port Sudan, Sudan (Approval No. REC-PAU 21/09; approval date: 5 March 2024). All participants provided written informed consent before enrollment. The study was conducted in accordance with the ethical principles of the Declaration of Helsinki.
Consent for Publication
Not applicable.
Availability of Supporting Data
The datasets generated and/or analyzed during the current study are available from the corresponding author on reasonable request.
Competing Interests
The author declares no competing interests.
Funding
This research received no specific grant from any funding agency in the public, commercial, or not-for-profit sectors.
Authors' Contributions
Bashir Abdrhman Bashir conceived and designed the study, supervised participant recruitment and laboratory investigations, performed the statistical analyses, interpreted the data, drafted the manuscript, critically revised the manuscript for important intellectual content, and approved the final version for publication.