Introduction
Diabetes mellitus is the most common metabolic disorder worldwide, affecting an estimated 537 million adults aged 20–79 years (10.5% of all adults) [1]. Over 90% of these individuals have Type 2 Diabetes Mellitus (T2DM) [2]. Traditionally considered a single disease, T2DM is now recognized as highly heterogeneous in terms of presentation, progression, treatment response, and risk of complications [3]. The pathophysiology of T2DM ranges from severe insulin resistance with near-normal β-cell function to normal insulin sensitivity with severe β-cell secretory defects [4]. Because of this heterogeneity, global scientific bodies are attempting to subclassify T2DM to improve individualized therapy and early risk identification.
In a study by Ahlqvist et al.,[5], distinct clusters of T2DM were identified in a Scandinavian population, showing differences in complication risk and treatment response. Anjana et al.,[6] conducted a similar study on 19,000 Indians from nine South Indian states using K-means clustering based on age at diagnosis, BMI, waist circumference, HbA1c, triglycerides, HDL cholesterol, and fasting and stimulated C-peptide levels. Four phenotypic clusters were identified:
-
Severe Insulin-Deficient Diabetes (SIDD) – 26.2% of patients; lowest BMI, waist, and C-peptide; low HOMA-B and HOMA-IR; highest HbA1c; most likely to require insulin.
-
Insulin-Resistant Obese Diabetes (IROD) – 25.9%; highest BMI, waist, and C-peptide; highest HOMA-B and HOMA-IR; intermediate metabolic control; mostly on metformin.
-
Combined Insulin-Resistant and Deficient Diabetes (CIRDD) – 12.1%; youngest onset; intermediate BMI; highest triglycerides, lowest HDL; intermediate C-peptide, HOMA-B, and HOMA-IR; poor control, only 15% on insulin.
-
Mild Age-Related Diabetes (MARD) – 35.8%; oldest onset; highest HDL, preserved C-peptide, best control, least insulin use.
Objectives
To classify T2DM patients attending Medicine/Endocrinology OPD into these clusters, study their clinical and biochemical profiles, and assess the prevalence of microvascular and macrovascular complications.
Materials and Methods
1) Study design and criteria
This single-centre, observational study was conducted over eighteen months from September 2022 to February 2024, in the Department of Medicine, of a tertiary care hospital in New Delhi where 100 patients with Type 2 Diabetes were recruited. Diabetes was diagnosed using the ADA Guidelines [7], fasting plasma glucose ≥126 mg/dL, 2-h post prandial Glucose ≥200 mg/dL during oral glucose tolerance test, HbA1c ≥6.5% or a random plasma glucose ≥200 mg/dL in a patient with classic symptoms of hyperglycemia or hyperglycemic crisis. The study began after getting approval from the Institutional Ethics Committee and obtaining a written informed consent from each patient fulfilling the exclusion and inclusion criteria for participation in the study.
2) Inclusion and exclusion criteria
All patients with Type 2 Diabetes older than 35 years of age were included. Diagnosed cases of Type 1 Diabetes and patients with retinopathy or nephropathy directly to other specific causes were excluded.
3) Methodology
After taking informed consent, a detailed history of age at onset, duration of symptoms, symptoms at onset and complications of diabetes were taken. Anthropometric measurements including height, weight, waist circumference were taken and clinical examination for neuropathy, using Monofilament test, fundus and urine examination was done in each case. Blood samples were collected for parameters like fasting and post prandial plasma glucose, lipid profile, liver and kidney function tests, glycated haemoglobin, fasting c-peptide levels and fasting insulin levels. The insulin resistance was estimated by the HOMA-IR equation, using the fasting insulin levels.
Patients were categorized into various phenotypic groups as per the algorithm as in figure 1.
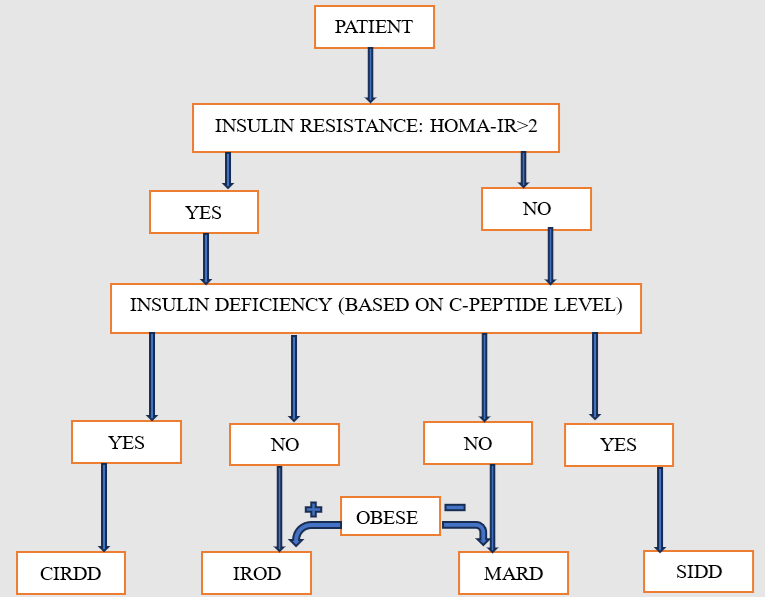
Cutoffs used were BMI ≥25 kg/m² for obesity [8], C-peptide ≤0.6 ng/mL for insulin deficiency [9], and HOMA-IR ≥2 for insulin resistance [10,11]. Clinical and biochemical characteristics were compared across the four clusters, including glycemic control, insulin requirement, comorbidities, and T2DM complications. Nephropathy was defined by micro- or macroalbuminuria; chronic kidney disease (CKD) as eGFR <60 mL/min/1.73 m² (CKD-EPI), classified into stages. Retinopathy was diagnosed on fundus exam; neuropathy via monofilament test. Macrovascular complications assessment included coronary artery disease (by history, ECG, 2D ECHO), cerebrovascular accident (CVA), and peripheral vascular disease (PVD).
Statistical Analysis
The data was entered in Microsoft Excel spreadsheet and analysis was done using Epi-Info, JASP and Statistical Package for Social Sciences (SPSS) version 23.0. Continuous variables were represented as mean ± SD or medians with Inter-quartile range and compared using Student's T test/ANOVA or Mann Whitney/ Kruskall Wallis. Categorical variables were represented as proportion/percentage (%) and compared using Chi Square or Fisher's Exact Test. Not all variables met the assumptions required for parametric; therefore, non-parametric tests (i.e., Mann-Whitney test, Spearman correlation) were used for all analyses for consistency.
Results
In this study, 55% of subjects were females while 45% were males, with a median age of 58 years. The average duration of illness was 8.0 ± 5.38 years.
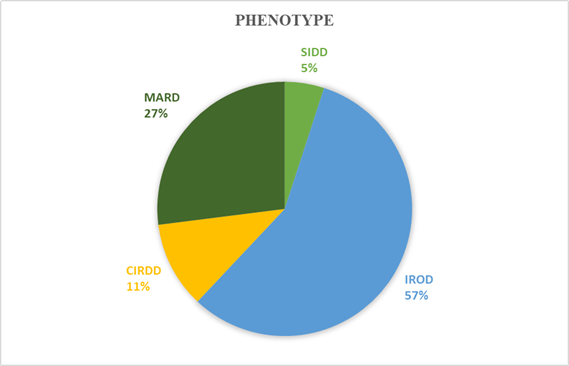
Of the 100 subjects in our study, Insulin Resistant Obese Diabetes (IROD), was the most common phenotype, with a total of 57 (57.0%) subjects belonging it. The Mild Age -Related Diabetes (MARD) phenotype included 27 (27.0%) subjects; while 11 (11.0%) subjects belonged to the Combined Insulin Resistant Deficient Diabetes (CIRDD) phenotype while only 5 (5.0%) subjects had the Severe Insulin Deficient Diabetes (SIDD) phenotype as shown in figure 2.
Majority of the subjects, 84%, were obese (BMI of ≥25 kg/m2) and 14% subjects were overweight (BMI 23-24.9) according to the Asian BMI cutoffs by WHO. Coronary artery disease (34%) and diabetic neuropathy (74%) were the most common macrovascular and microvascular complications respectively. Most subjects had uncontrolled fasting (67%) and postprandial blood sugars (70%). HbA1c levels ranged from 5.3 to 14.0%, with 74% having uncontrolled levels. C-peptide levels indicated that 16% were insulin deficient and based on HOMA-IR, Insulin resistance was noted in 74% of subjects. Clinical and biochemical profile of the enrolled patient is depicted in table 1 and distribution of different macrovascular or microvascular complication shown in table 2.
| SIDD | IROD | CIRDD | MARD | P- value | |
| Frequency | 5% | 57% | 11% | 27% | |
| Demographic Profile | |||||
| Men [%] | 40% | 40.35% | 63.64% | 48.15% | 0.532 |
| Age at Diagnosis [Mean (SD), years] | 43.6 (4.27) | 49.65 (8.41) | 48.36 (10.49) | 51.04 (8.4) | 0.323 |
| Biochemical Profile | |||||
| BMI [Median (IQR), kg/m2] | 43.6 (4.27) | 49.65 (8.41) | 48.36 (10.49) | 51.04 (8.4) | <0.001 |
| Fasting blood sugar [Mean (SD), mg/dl] | 142.6 (21.28) | 170.79 (48.81) | 156.82 (45.09) | 139.63 (40.36) | 0.011 |
| Post Prandial Blood sugar [Mean (SD), mg/dl] | 217.6 (40.47) | 247.65 (68.1) | 216.27 (79.23) | 210.81 (63.24) | 0.034 |
| HbA1c [Mean (SD), g/dl] | 8.3 (1.28) | 8.27 (1.71) | 8.77 (1.41) | 7.89 (1.63) | 0.318 |
| Total Cholesterol [Mean (SD), mg/dl] | 160.6 (46.08) | 163.73 (57.95) | 136.36 (50.92) | 155.19 (49.58) | 0.595 |
| LDL cholesterol [Mean (SD), mg/dl] | 106.2 (15.66) | 94.14 (44.41) | 86.27 (38.03) | 94.41 (32.14) | 0.864 |
| Serum Triglycerides [Mean (SD), mg/dl] | 179.4 (44.8) | 148.04 (59.68) | 100.09 (32.65) | 139.93 (52.41) | 0.016 |
| HDL cholesterol [Mean (SD), mg/dl] | 43.0 (3.16) | 39.3 (8.02) | 48.91 (12.51) | 38.11 (7.87) | 0.009 |
| eGFR [Mean (SD), ml/min] | 82.4 (36.45) | 79.12 (38.32) | 91.36 (30.98) | 75.78 (38.49) | 0.67 |
| Metabolic Profile | |||||
| c-peptide [Mean (SD), ng/ml] | 0.5 (0.08) | 5.44 (3.92) | 0.5 (0.18) | 3.44 (2.84) | <0.001 |
| HOMA-IR [Mean (SD)] | 4.88 (5.89) | 13.32 (18.44) | 4.54 (6.03) | 4.58 (9.13) | <0.001 |
| Treatment Profile | |||||
| Insulin at registration | 60% | 33.33% | 18.18% | 40.47% | 0.362 |
| Phenotypic Cluster | P-Value | |||||
| SIDD | IROD | CIRDD | MARD | |||
| Macrovascular Complication | ||||||
| CAD | Present | 0 (0.0%) | 20 (35.09%) | 4 (36.36%) | 10 (37.04%) | 0.433 |
| CVA | Present | 0 (0.0%) | 9 (15.79%) | 2 (18.18%) | 2 (7.41%) | 0.542 |
| PVD | Present | 1 (20.0%) | 3 (5.26%) | 1 (9.09%) | 2 (7.41%) | 0.65 |
| At least 1 Macrovascular complication | Present | 1 (20.0%) | 28 (49.1%) | 5 (45.5%) | 11 (40.7%) | 0.649 |
| Microvascular Complication | ||||||
| Retinopathy | Present | 1 (20.0%) | 14 (24.56%) | 4 (36.36%) | 8 (29.63%) | 0.83 |
| Neuropathy | Present | 5 (100.0%) | 39 (68.42%) | 7 (63.64%) | 20 (74.07%) | 0.451 |
| Nephropathy | Present | 3 (60.0%) | 25 (43.86%) | 2 (18.18%) | 15 (55.56%) | 0.18 |
| At least 1 Microvascular complication | Present | 5 (100.0%) | 43 (75.4%) | 8 (72.7%) | 22 (81.5%) | 0.689 |
Discussion
In this study we aimed to classify patients with type 2 diabetes into phenotypic clusters. This sub- classification was based on the salient features of the subtypes described in the INSPIRED study by Anjana et al.[6] Classification was done using three features including, Body Mass Index, C- peptide levels (marker of Beta cell function) and HOMA – IR (marker of insulin resistance). Our study provides comprehensive insights into the phenotypic clusters of Type 2 Diabetes Mellitus (T2DM) in the Indian population, shedding light on various demographic, clinical, and metabolic parameters.
Demographic Characteristics
In this study, the majority of subjects (n=36, 36%) were aged 50–59 years, with a mean age of 57.58 years. The ICMR-INDIAB study also reported the highest prevalence in the 50–69 years age group [14].
There was a slight female preponderance with Male: Female ratio 0.81.
The average age at diabetes onset was 49.58 years, with an average disease duration of 8.0 years.
A strong association between obesity and diabetes was observed: 84% of participants were obese, and 14% were overweight, corroborating previous large-scale studies [17,18] and underscoring the importance of weight management in diabetes prevention and control.
Macrovascular Complications
Among macrovascular complications, coronary artery disease (CAD) was most prevalent (n=34, 34%), followed by cerebrovascular accident (CVA) (n=13, 13%) and peripheral vascular disease (PVD), (n=7, 7%). These results are comparable to previous studies. The Chennai Urban Population Study reported CAD prevalence of 21.4% among individuals with T2DM [19], while Agrawal et al.[20] observed CAD in 25.8% and PVD in 28% of patients.
Microvascular Complications
Neuropathy was the most frequent microvascular complication (n=71, 71%), followed by nephropathy (n=45, 45%) and retinopathy (n=27, 27%). Pradeepa et al.[21] also reported diabetic retinopathy in 17.5%, neuropathy in 25.7%, overt nephropathy in 5.1%, and microalbuminuria in 26.5% of subjects. Agrawal et al. [20] reported retinopathy in 32.5%, nephropathy in 30.2%, and neuropathy in 26.8%, supporting the concordance of our results with prior literature.
Glycemic Control:
A majority of subjects exhibited uncontrolled diabetes: FBS >130 mg/dL in 67% (n=67), PPBS >180 mg/dL in 70% (n=70), and HbA1c >7% in 74% (n=74). Mean values were FBS 159.43 ± 47.55 mg/dL, PPBS 232.75 ± 69.58 mg/dL, and HbA1c 8.22 ± 1.67%.
Insulin Secretion and Resistance
C-peptide levels <0.6 ng/mL were observed in 16% (n=16) of participants, indicating insulin deficiency. Using the HOMA-IR index, 26% (n=26) were classified as insulin-sensitive (HOMA-IR <2), whereas 74% (n=74) were insulin-resistant (HOMA-IR ≥2), demonstrating that insulin resistance predominates among diabetics in our cohort.
Distribution of Phenotypes
In this study, the Insulin-Resistant Obese Diabetes (IROD) phenotype was the most prevalent (n=57, 57%), followed by Mild Age-Related Diabetes (MARD) (n=27, 27%), Combined Insulin-Resistant and Deficient Diabetes (CIRDD) (n=11, 11%), and Severe Insulin-Deficient Diabetes (SIDD) (n=5, 5%). However, the ICMR-INDIAB study [22] observed MARD as the predominant phenotype (34.8%), followed by IROD (30.3%), SIDD (27.4%), and CIRDD (7.6%). These variations may be attributed to regional differences, study population characteristics, and sample sizes.
Severe Insulin-Deficient Diabetes (SIDD)
Subjects in the SIDD phenotype were the youngest of the four groups (median age 49 years) and the highest proportion of females (n=60, 60%). The median age of onset was 44.0 years, with the longest mean duration of illness (9.4 years).
Glycemic parameters showed median FBS of 140 mg/dL, PPBS of 210 mg/dL, and HbA1c of 8.5 g/dL, which were intermediate among the four phenotypes. Anjana et al.[6] and ICMR-INDIAB [22] reported higher mean HbA1c levels in SIDD (10.7 g/dL and 10 g/dL, respectively).
Complications in SIDD were predominantly microvascular. None of the subjects had CAD or CVA; PVD was present in 20%, neuropathy in 100%, retinopathy in 20%, and nephropathy in 60%. The high prevalence of microvascular complications likely reflects poor glycemic control and long disease duration.
Metabolic profiling revealed lowest median C-peptide (0.54 ng/mL), fasting insulin (2.38 μIU/mL), and HOMA-IR (0.79), consistent with a primary insulin-deficient phenotype. Lipid analysis showed triglycerides 179.4 mg/dL, total cholesterol 160.6 mg/dL, LDL 106.2 mg/dL, and the second-highest HDL 43 mg/dL. Treatment patterns indicated 40% on OHA and 60% on insulin, similar to previous studies showing the highest insulin use in SIDD [6].
Insulin-Resistant Obese Diabetes (IROD)
The IROD phenotype comprised the second oldest group, with a mean age of 57.35 years, second only to SIDD. Median age of onset was 49.65 years, and the mean duration of illness was 7.7 years. ICMR-INDIAB [22] reported similar older ages at diagnosis for IROD (mean 46.5 and 48.2 years, respectively).
This group had the second-highest BMI (28.69 kg/m²). Median glycemic values were FBS 160 mg/dL, PPBS 233 mg/dL, and mean HbA1c 8.27 g/dL, ranking third highest among phenotypes.
Macrovascular complications were most prevalent in IROD: CAD 35.09%, CVA 15.79%, and PVD 5.26%, likely related to obesity and dyslipidemia. Microvascular complications were substantial: retinopathy 24.56%, neuropathy 68.42%, and nephropathy 43.86%.
Metabolic profiling confirmed insulin resistance: median fasting insulin 15.3 μIU/mL, C-peptide 4.09 ng/mL, and HOMA-IR 5.68 were the highest among phenotypes. Lipid analysis showed the lowest HDL (38 mg/dL). Treatment distribution favoured OHA (66.67%), with 33.33% on insulin, compared to 90.4% OHA use in Anjana et al.[6].
Combined Insulin-Resistant and Deficient Diabetes (CIRDD)
The CIRDD phenotype had a mean age of 56.45 years and the lowest female representation (36.36%). Mean age of onset, duration, and BMI were 48.36 years, 8.09 years, and 27.63 kg/m², respectively, placing CIRDD third among the phenotypes in these parameters.
CIRDD subjects had the highest prevalence of CVA (18.18%), while CAD (36.36%) and PVD (9.09%) were second highest. Microvascular complications were variable: retinopathy 36.36% (highest), neuropathy 63.64%, and nephropathy 18.18% (lowest). Mean HbA1c was 8.77 g/dL, higher than most phenotypes, consistent with prior studies reporting elevated HbA1c in CIRDD [6,22]. Dyslipidemia was present in 18.2%, the lowest among phenotypes. Median total cholesterol 148 mg/dL, triglycerides 97 mg/dL, LDL 90 mg/dL, and HDL 45 mg/dL were reported. Treatment largely involved OHA (81.82%), with remaining subjects on insulin (85% OHA, 15% insulin).[6]
Mild Age-Related Diabetes (MARD)
The MARD phenotype had a median age of 56.0 years. The mean age of onset was 51.04 years, and mean disease duration was 8.33 years, making this the oldest phenotype.
MARD subjects had the lowest BMI (26.01 ± 2.71 kg/m²), aligning with previous studies [6,22]. Macrovascular complications were frequent with CAD 37.04%, CVA 7.41%, PVD 7.41%, likely influenced by age. Microvascular complications included retinopathy 29.63%, neuropathy 74.07%, and nephropathy 55.56%. Dyslipidemia prevalence was highest (74.1%).
Glycemic control in MARD was relatively better: FBS 139.6 mg/dL, PPBS 210.8 mg/dL, and HbA1c 7.89 g/dL, consistent with ICMR-INDIAB [22]. Treatment was balanced: OHA 59.26%, insulin 40.74%.
This comprehensive analysis highlights the heterogeneity of T2DM within our cohort. IROD was the most prevalent phenotype, while SIDD was least frequent. Each phenotype displayed distinct patterns in age, gender distribution, BMI, glycemic control, complications, lipid profile, and treatment, consistent in part with prior studies, but with notable variations likely due to regional, sample size, and population-specific differences. Understanding these distinctions can guide individualized treatment strategies and targeted interventions for micro- and macrovascular complications.
Limitations
The research was conducted in a single Centre, potentially introducing bias related to geographical and demographic factors and the relatively small sample size of 100 subjects might limit the generalizability of findings to a broader population of diabetic patients. It has been seen in previous follow-up studies that patients switched among clusters as the disease progressed. Longitudinal studies could provide better insights into temporal relationships between various parameters. Also, the time from diagnosis of diabetes was not used as an exclusion criterion. This resulted in individuals in different stages of the disease being assessed together leading to overlapping results. Thus, the study failed to account for the change in biomarkers over time, which are dependent on the disease course or its treatment.
Conclusions and Recommendations
This study provides insights into distinct phenotypic clusters of T2DM in the North Indian population, which were divided using a simple algorithm. It highlights the variations in demographics, glycemic parameters, and metabolic profiles among the clusters. Our findings align with previous research, confirming the heterogeneity of T2DM and emphasizing the importance of personalized management strategies. Such subclassification could represent the first step in our approach toward precision medicine in diabetes. Further research is warranted to validate these findings and optimize management strategies for T2DM in India.
Declarations
Conflicts of interest
Nil
Financial Support
This research received no external funding
Ethics and RCT code
Approved by Institutional ethics committee of Maulana Azad Medical College- Approval No. F.1/IEC/MAMC/MD/MS (92/04/2022/No.336
Authors Contributions
Conceptualization, N.G., S.G., S.A., B.G., H.S.; methodology, N.G., S.G.; software, N.G.,; validation, N.G., S.G., S.A., B.G., H.S; formal analysis, N.G.; investigation, N.G., M.M., R.G.; resources, N.G.; data curation, N.G., M.M., R.G.; writing—original draft preparation, N.G.; writing—review and editing, S.G.,M.M., R.G.; supervision, S.G., S.A., B.G., H.S; project administration, S.G., S.A., B.G., H.S; funding acquisition, S.G.