
Abstract
This paper presents a comprehensive investment decision framework aimed at guiding investors in determining the optimal timing for market entry and exit within the tanker market, with a particular focus on the decision between investing in newbuilding versus secondhand Very Large Crude Carrier (VLCC) vessels. The study utilizes a robust dataset spanning from January 1999 to June 2021, comprising 348 observations, and applies Ordinary Least Squares (OLS) regression to construct two econometric models, one using monthly (Model 1) and the other using quarterly (Model 2) frequency data. Global macroeconomic variables, including crude oil production, steel production, and industrial output from major economies such as China and Europe, are incorporated as primary determinants of investment decisions, while control variables such as LIBOR interest rates, SDR exchange rates, and Brent crude oil prices are included to enhance model precision and robustness. The data analysis was conducted using MATLAB, with rigorous diagnostic tests, including T-tests, F-tests, multicollinearity checks, stationarity assessments, and Engle-Granger cointegration tests, ensuring the validity and reliability of the models. This study is grounded in established international trade theories—Comparative Advantage, Heckscher-Ohlin, New Trade Theory, and Real Options Theory—providing a theoretical foundation for understanding the timing of market entry, exit, and investment decisions under the inherently volatile and cyclical conditions of the tanker market. The results reveal that global steel production, VLCC scrap value, Suezmax secondhand prices, Aframax fleet development (dwt), and Aframax crude fleet growth rate are key factors that influence the timing of VLCC investment decisions. Specifically, Aframax fleet development (dwt) emerges as the most significant determinant for newbuilding investments, while a combination of co-integrated variables is identified as crucial for decisions concerning the secondhand vessel market. This study offers valuable decision-making tools for investors and industry stakeholders, providing insights that can enhance investment strategies, improve profitability, and mitigate the risks associated with market fluctuations. Furthermore, it contributes to the scholarly literature by advancing understanding of investment dynamics in the shipping industry, thereby paving the way for future research into the broader implications of maritime economics.
Keywords
Ship Investment strategy VLCC Tanker Market Newbuilding vs. Secondhand Vessel Investment Macroeconomic Determinants Cointegration Analysis Market Timing OLS Regression Real Options Theory.
1. Introduction
Seaborne trade is the structural backbone of the global economy: roughly ninety per cent of internationally traded goods by volume move by sea (Talley & Ng, 2013). The resilience of this network was illustrated during the 2020 pandemic, when global seaborne trade contracted by only 4.1 per cent despite unprecedented disruption (UNCTAD, 2020). Within the maritime sector, the liquid bulk segment occupies a strategic position, and Very Large Crude Carriers (VLCCs) are the principal vessels through which crude oil — the world's most heavily traded commodity by value — reaches refineries (Alizadeh & Nomikos, 2004).
Investment in the VLCC market is, however, persistently fraught with structural difficulty. The volatility of vessel prices, freight rates, and interest rates, conjoined with the extreme capital intensity of the asset class and the long, irregular rhythms of the shipping cycle (Stopford, 2009), confronts investors with two interlocking decisions at every turn: when to enter or exit the market, and whether to commit capital to a newbuilding vessel — with delivery typically eighteen to twenty-four months out and a thirty-year operating life — or to a secondhand vessel, deployable within weeks but carrying a shorter remaining life and more immediate exposure to retrofit and compliance costs. The existing literature has examined cost of capital, oil prices, and freight rates as determinants of vessel pricing (Alizadeh & Nomikos, 2006; Cheng & Duran, 2004; Kavussanos & Visvikis, 2006), and has addressed lead–lag relationships between newbuilding and secondhand prices (Kou et al., 2014; Tsolakis et al., 2003). Comparatively less attention has been paid, however, to the long-run cointegration relationships between fleet development, steel production, and the VLCC newbuilding-to-secondhand (NB/SH) price ratio — the very relationships that, this paper contends, contain the most decision-relevant information for a capital-intensive market characterised by non-linear and time-varying freight-rate dynamics (Adland & Cullinane, 2006).
This paper accordingly asks: which macroeconomic and fleet-side variables exhibit a stable long-run cointegration relationship with the VLCC newbuilding-to-secondhand price ratio, and how can this relationship be operationalised as a decision rule for investment timing and vessel-type selection? The empirical strategy uses Ordinary Least Squares (OLS) regression on two parallel cointegration models — a monthly model with 263 observations (January 1999 to December 2020) and a quarterly model with 85 observations (Q1 2000 to Q2 2021) — with Brent crude price, the LIBOR interest rate, and the SDR exchange rate as control variables and an Error Correction Term capturing both short- and long-run dynamics. The theoretical scaffolding draws on Comparative Advantage Theory (Ricardo, 1817), Heckscher–Ohlin trade theory (Ohlin, 1933), New Trade Theory (Krugman, 1979), the Gravity Model (Tinbergen, 1962), and Real Options Theory (Dixit & Pindyck, 1994).
The paper contributes by identifying five cointegrated macro- and fleet-side determinants of the VLCC NB/SH ratio, by demonstrating that the quarterly-frequency model materially outperforms the monthly one (adjusted R² = 66.1 per cent versus 54.0 per cent), and by deriving from these relationships a practical decision rule for shipowners and financiers: in particular, that Aframax fleet development is the single most informative variable for newbuilding decisions, while a wider set of cointegrated variables governs the secondhand decision.
The remainder of the paper is organised as follows. Section 2 reviews the literature on ship investment and the newbuilding-versus-secondhand choice and develops the theoretical framework. Section 3 describes the data, model specification, and analytical procedure. Section 4 reports the results. Section 5 discusses the economic logic of each significant determinant. Section 6 derives theoretical and practical implications. Section 7 sets out the limitations and a research agenda, and Section 8 concludes.
| Ship type | Capacity (dwt) | Product carried |
|---|---|---|
| ULCC / VLCC | ≥ 200,000 | Crude oil |
| Suezmax | 125,000 – 199,999 | Crude oil |
| Aframax | 85,000 – 124,999 | Crude oil and oil products |
| Panamax | 55,000 – 84,999 | Crude oil and oil products |
| Handysize | 10,000 – 54,999 | Oil products and chemicals |
| Small tanker | < 10,000 | Oil products and chemicals |
| Shuttle tanker | Variable | Crude oil (offshore lift) |
| Asphalt / bitumen carrier | Variable | Asphalt and bitumen |
Note. Dwt = deadweight tonnage. Source: Clarkson's Shipping Intelligence Network.
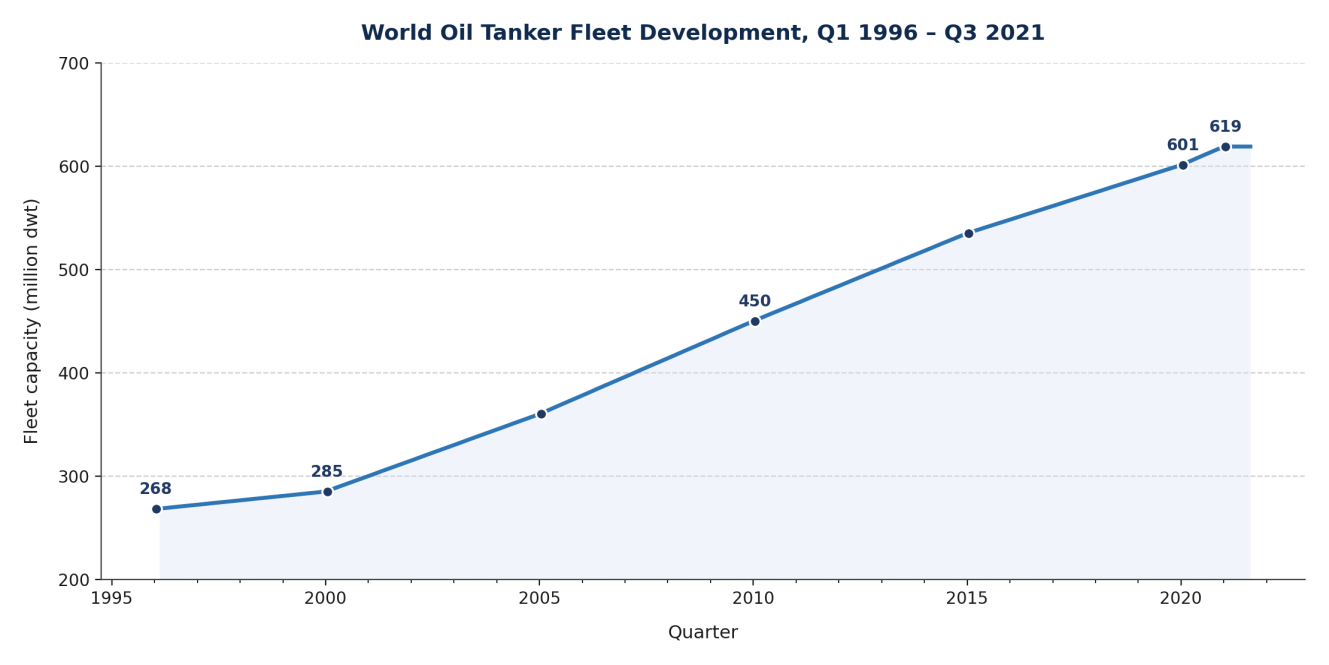
Across the period of analysis, the world oil tanker fleet has exhibited a persistent and incremental expansion. Capacity rose from approximately 268 million dwt in early 1996 to around 619 million dwt by mid-2021, with the rate of growth accelerating in the mid-2000s before moderating after 2010 (UNCTAD, 2024). The long-run expansion shown in Figure 1 provides the structural backdrop against which the investment-timing analysis of this paper operates.
2. Literature Review and Theoretical Framework
2.1 Ship Investment under Uncertainty
Ship investment decisions have been examined extensively through the analytical lenses of valuation, market dynamics, and risk management. Alizadeh and Nomikos (2006) underscore the necessity of evaluating ship prices relative to their intrinsic value in a context of pronounced volatility, while Kavussanos and Visvikis (2006) emphasise the sector's structural cyclicality and the corresponding need for hedging instruments. The non-linearity of the underlying freight-rate process has itself been a focus of attention: Adland and Cullinane (2006), for instance, model freight rate volatility as a function of the rate level itself, demonstrating that traditional linear specifications miss substantive features of the data-generating process. Within this analytical setting, Xu et al. (2011) establish a causal link from freight rates to newbuilding prices in the dry bulk market, illustrating that freight-market signals propagate — with detectable lag and asymmetry — into the investment decision. Luo (2015) refines this picture by showing that larger and newer vessels exhibit lower price sensitivity to freight-rate fluctuations, a finding that complicates the conventional view that vessel size and price risk are uniformly positively correlated.
Fan and Luo (2013) approach ship investment from a discrete-choice perspective, employing binary and nested logit specifications to identify systematic differences between large and small carriers in their capacity-expansion strategies and their preferences over newbuilds, secondhand vessels, and specific size classes. Their work points to a meaningful heterogeneity in investment behaviour that is frequently obscured by aggregate market analysis, and that any framework which aspires to capture the full structure of the investment problem must accordingly accommodate.
2.2 Newbuilding versus Secondhand: The Choice Problem
The dynamics linking newbuilding and secondhand markets are central to the strategic decisions of investors, shipowners, and lenders. Kou et al. (2014) examine the lead–lag relationship between the two market segments and emphasise the importance of cycle timing. Tsolakis et al. (2003) show that during economic downturns, fluctuations in newbuilding prices exert a stronger pull on secondhand prices than in upturns, as liquidity in newbuild orders contracts and operators turn to the secondhand market. Alizadeh and Nomikos (2009) reinforce this by demonstrating that the relationship between newbuilding and secondhand prices becomes most pronounced under conditions of low market liquidity, indicating that global macroeconomic conditions affect price dynamics asymmetrically across cycles.
Merikas et al. (2008) and Veenstra (1999) note that investment decisions in the tanker market depend not only on contemporaneous conditions but also on agents' expectations of future trends, and that this forward-looking element tends to make secondhand vessels appear less risky during periods of elevated uncertainty. Alexandridis et al. (2017) observe that smaller vessels exhibit lower price volatility than larger counterparts, suggesting a stability premium for downsized investment. Chen and Chang (2006), Lee and Rui (2002), and Kavussanos (2015) all converge on the conclusion that the newbuilding–secondhand choice is determined by a combination of freight rates, vessel age, and global economic conditions, with newbuilding prices rising in boom periods to reflect investor optimism and secondhand prices becoming more attractive in downturns owing to their flexibility.
2.3 Theoretical Foundations
The present study sits at the intersection of five theoretical traditions. Comparative Advantage Theory (Ricardo, 1817) explains why specialisation in shipping services emerges and persists across nations. Heckscher–Ohlin trade theory (Ohlin, 1933) interprets trade flows — and therefore tanker demand — as a function of factor endowments. New Trade Theory (Krugman, 1979) accounts for the role of economies of scale, helping explain why the VLCC class exists in the size range it does. The Gravity Model (Tinbergen, 1962) links bilateral trade volumes to economic mass and geographic distance, providing structural underpinning for tanker route economics. Real Options Theory (Dixit & Pindyck, 1994) supplies the most directly applicable framework: it treats the investor's right to defer, expand, or exit a capital-intensive position as itself having value, and shows why optimal investment timing in a volatile, capital-intensive market typically waits longer than a deterministic net-present-value calculation would suggest.
Together these traditions justify the empirical strategy adopted below: a search for stable long-run relationships between macroeconomic and fleet-side variables and the VLCC NB/SH price ratio, treated as the decision-relevant ratio for entry, exit, and vessel-type choice. The conceptual mapping of dependent, independent, and control variables is depicted in Figure 2.
3. Methodology
3.1 Data and Variables
All data are sourced from Clarkson's Shipping Intelligence Network. Two parallel datasets are constructed to test the robustness of findings to data frequency: a monthly series comprising 263 observations from January 1999 to December 2020 (Model 1) and a quarterly series comprising 85 observations from Q1 2000 to Q2 2021 (Model 2). The dependent variable in both models is the VLCC newbuilding-to-secondhand price ratio (NB/SH ratio), which serves as the decision-relevant indicator for investment timing and vessel-type choice. Independent variables capture the principal macroeconomic and fleet-side drivers of tanker market dynamics: global crude oil production, world steel production, industrial production in China and Europe, VLCC demolition and scrap value, Suezmax secondhand price, Aframax fleet development (dwt), VLCC fleet development, the ULCC/VLCC orderbook, and the Aframax crude tanker orderbook. Financial conditions are controlled through Brent crude oil price, the LIBOR interest rate, and the SDR exchange rate (Austin, 2010; Stasinopoulos, 2015). A complete list of variables with their abbreviations, descriptions, and units is provided in Appendix A.
3.2 Model Specification
Two general-form OLS regression models are estimated, one per frequency. For Model 1 (monthly):
Y₁ₜ = β₀ + β₁X₁ₜ + β₂X₂ₜ + … + βₖXₖₜ + μ₁ₜ
and for Model 2 (quarterly):
Y₂ₜ = β₀ + β₁X₁ₜ + β₂X₂ₜ + … + βₖXₖₜ + μ₂ₜ
where Y₁ₜ and Y₂ₜ are the monthly and quarterly VLCC NB/SH price ratios respectively, X₁ₜ … Xₖₜ are the macroeconomic and fleet-side regressors, β₀ is the intercept, β₁ … βₖ are slope coefficients, and μₜ is the residual. The residual is required to be integrated of order zero — μₜ ~ I(0) — if the regressors and the dependent variable are to be cointegrated. The null and alternative hypotheses on each individual slope are:
H₀: βₖ = 0 H₁: βₖ ≠ 0
An Error Correction Term (ECT) is included in both models to capture the short-run dynamics of adjustment toward the long-run equilibrium implied by the cointegration relationship. A decision-rule mapping is applied to interpret the regression coefficients: a positive coefficient indicates that the variable shifts the NB/SH ratio upward, favouring newbuilding vessels; a negative coefficient indicates that the variable shifts the ratio downward, favouring secondhand vessels. A rising NB/SH ratio is therefore read as a signal to invest in newbuildings and divest secondhand; a falling ratio, the reverse.
3.3 Analytical Procedure
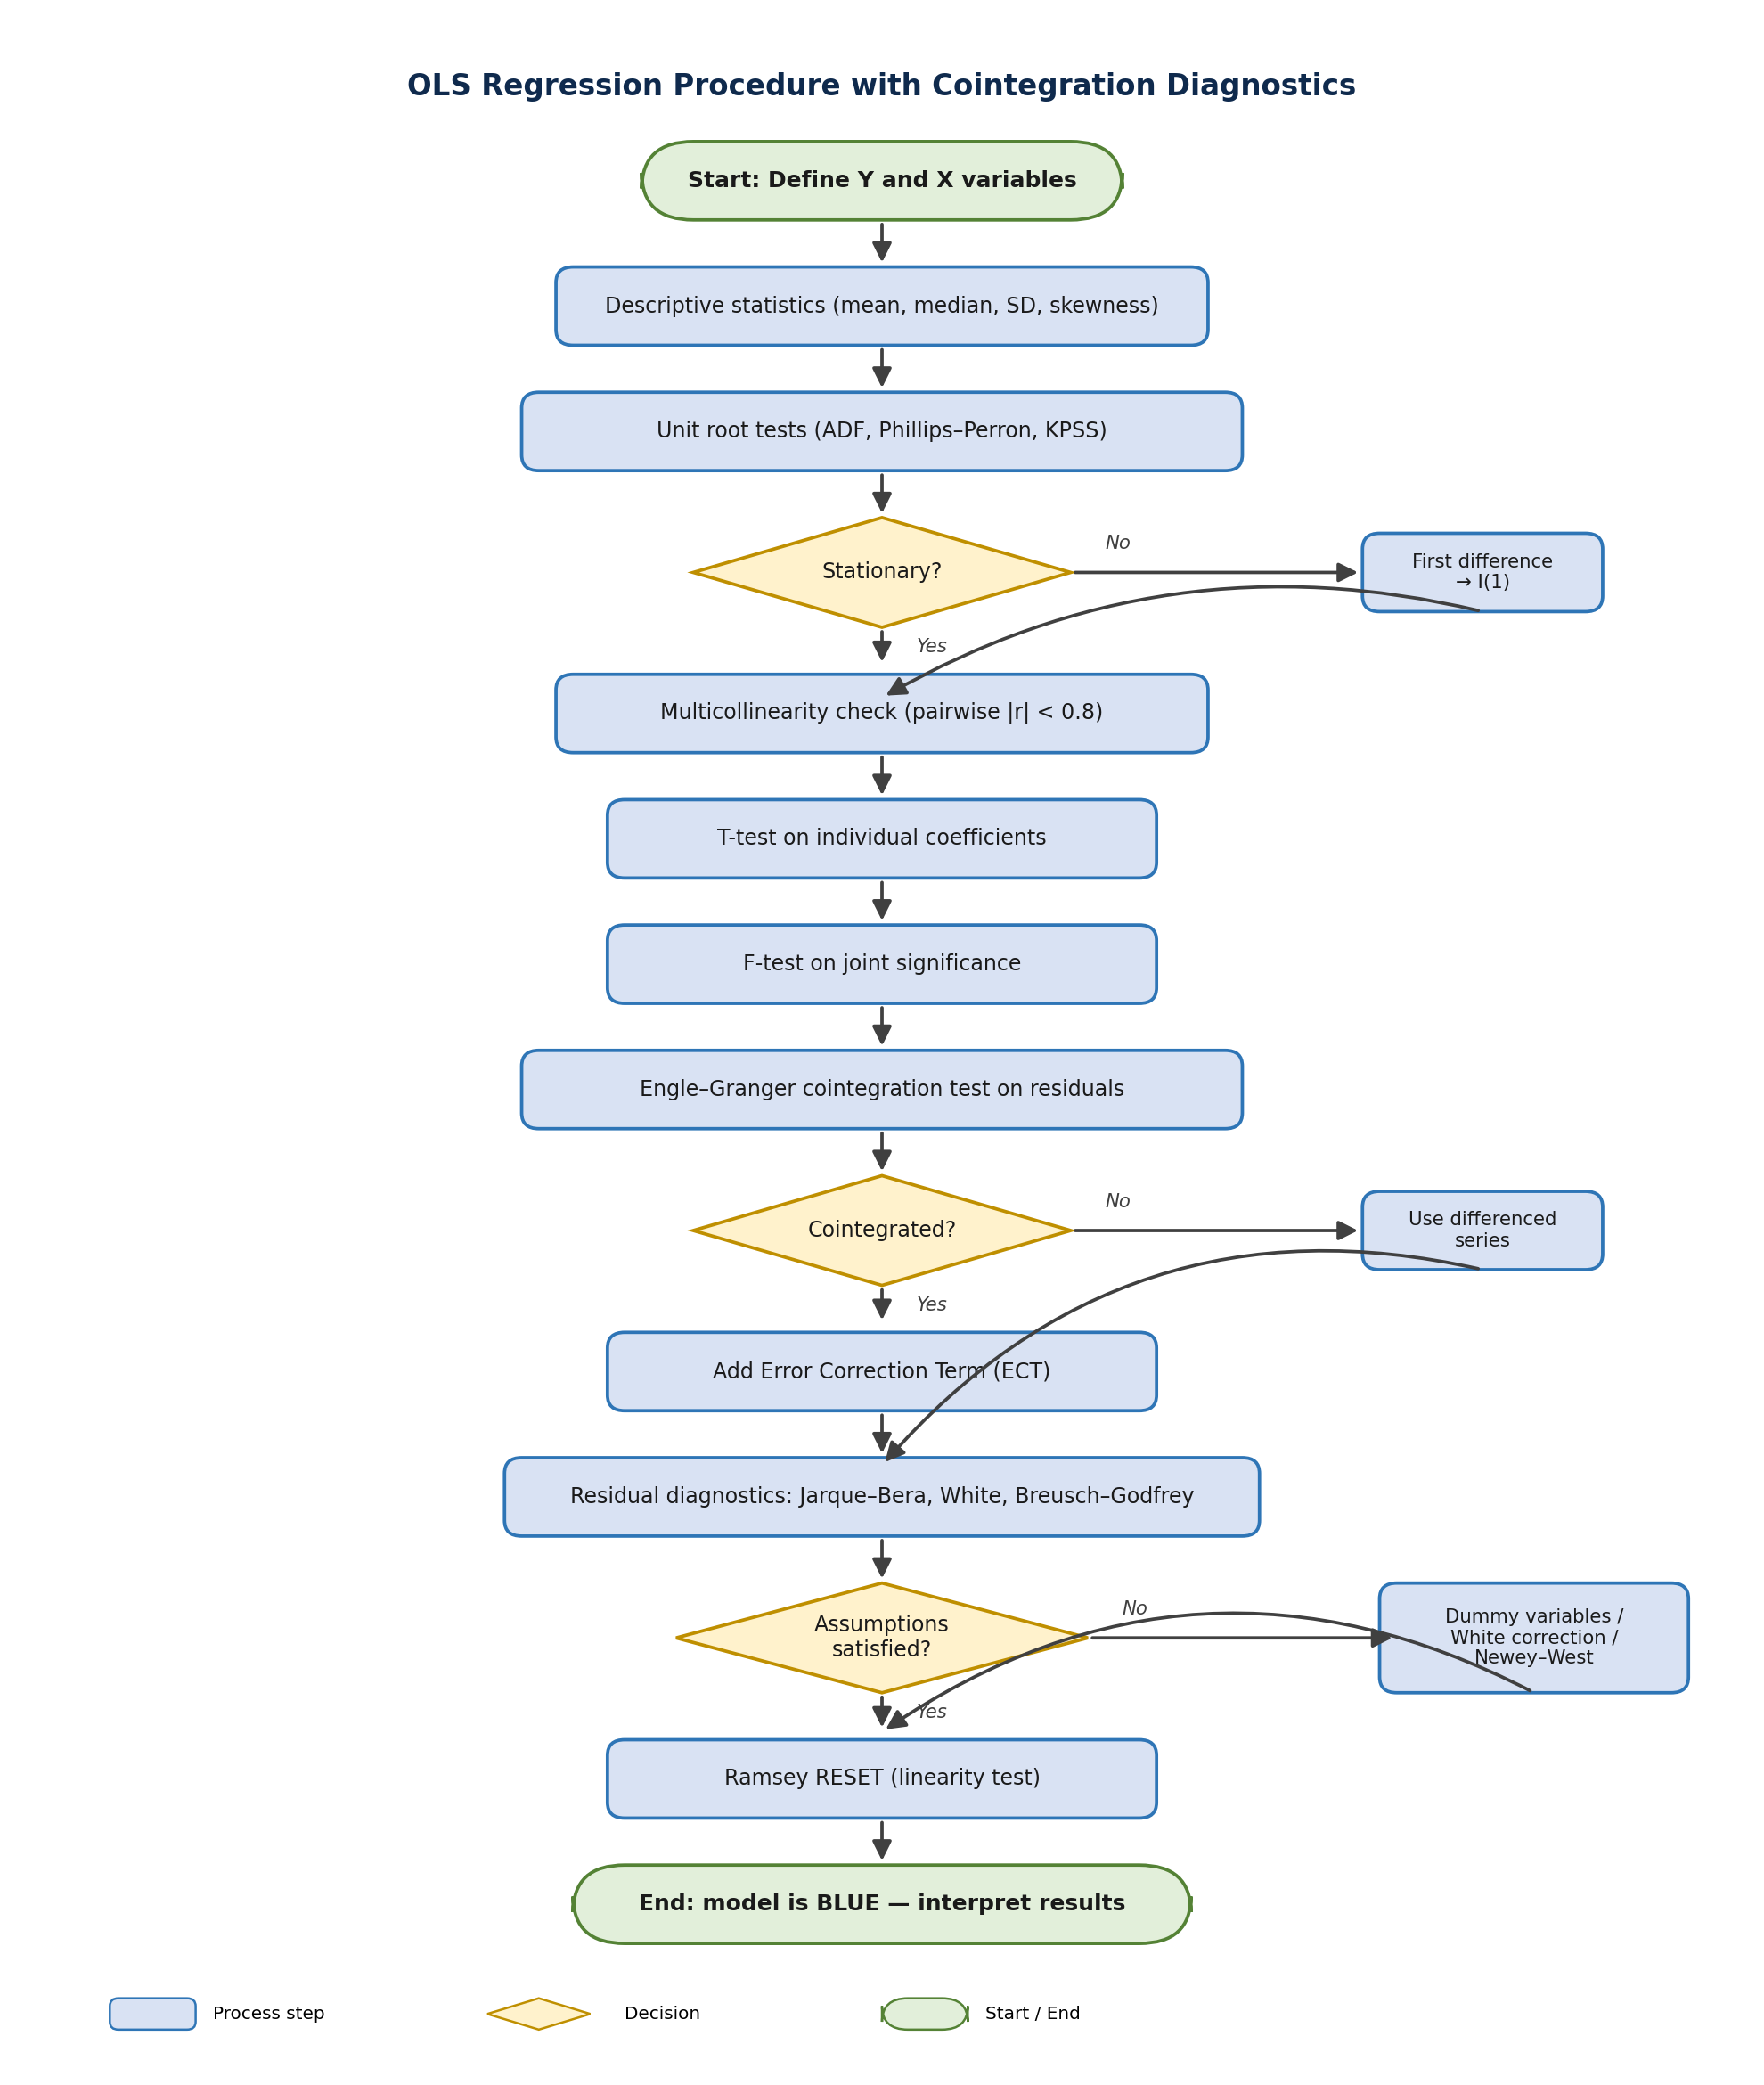
Estimation proceeds in MATLAB R2019a, following the procedure depicted in Appendix B. Descriptive statistics are computed for each variable to establish data consistency and identify potential sources of spurious regression (Harris, 1995). Unit root tests — Augmented Dickey–Fuller (ADF), Phillips–Perron (PP), and Kwiatkowski–Phillips–Schmidt–Shin (KPSS) — establish the order of integration of each series (Zeng, 2017). Multicollinearity is assessed by pairwise correlation among the regressors, with a threshold of |r| < 0.80 (Daoud, 2017). Significance of individual coefficients is tested by t-tests, and joint significance by F-tests, both at α = 0.05 (Abebe, 2019). The Engle–Granger procedure is applied to test the residuals for cointegration; where cointegration is established, the ECT is incorporated into the final specification. ARMA terms are tested for inclusion and retained only where individually significant. Residual diagnostics comprise the Jarque–Bera normality test (Lambey, 2020), the White test for heteroskedasticity and ARCH effects, the Breusch–Godfrey test for serial correlation (14 lags), and the Ramsey RESET test for functional form. Where the residuals fail normality, the model is augmented with dummy variables identifying influential observations; where heteroskedasticity is detected, White's correction is applied. Model fit and competing specifications are compared on adjusted R², the Akaike Information Criterion (AIC), the Bayesian Information Criterion (BIC), and the Consistent AIC (CAIC), with the model satisfying the Gauss–Markov conditions preferred for inference.
4. Results
This section reports the empirical findings in five parts. Section 4.1 presents the descriptive statistics. Sections 4.2 and 4.3 report the stationarity, multicollinearity, and significance testing. Section 4.4 reports the cointegration and residual diagnostics. Section 4.5 compares the two models and selects the preferred specification, providing the empirical foundation for the discussion that follows.
4.1 Descriptive Statistics
Across the 1999–2020 monthly dataset (Model 1), most variables are positively skewed, indicating that observations are concentrated below the mean with occasional high values pulling the mean upward; a smaller subset is negatively skewed. The largest standard deviations are observed for VLCC demolition prices, the ULCC/VLCC orderbook (dwt), average VLCC long-run historical earnings, average Suezmax long-run historical earnings, and the Aframax crude tanker orderbook. The 2000–2021 quarterly dataset (Model 2) shows a comparable pattern, with the largest standard deviations attaching to HSFO 380 cst Singapore bunker prices, average Suezmax long-run historical earnings, world steel production, the Aframax orderbook, and the Suezmax orderbook. The breadth of this variation across both datasets confirms the volatility that motivates the cointegration approach.
4.2 Stationarity and Multicollinearity
The ADF, PP, and KPSS unit root tests indicate that all variables in both models are non-stationary in levels and stationary in first differences — each series is I(1) — with p > 0.05 in levels and p < 0.05 after differencing. Pairwise correlations among the candidate regressors are below the |r| = 0.80 threshold in both models, indicating no material multicollinearity. The data are therefore suitable for the Engle–Granger cointegration procedure.
4.3 Individual and Joint Significance
After elimination of insignificant variables by sequential application of the t-test (α = 0.05) and subsequent F-tests, three variables retain significance in Model 1: the Coated Panamax newbuilding tanker price (73,000–75,000 dwt), the VLCC scrap value, and the Suezmax double-hull 160,000 dwt 5-year-old secondhand price. Four variables retain significance in Model 2: the Suezmax double-hull 160,000 dwt 5-year-old secondhand price, the Aframax tanker fleet development (dwt million), world steel production (000′t), and the crude Aframax fleet growth (per cent per year). The VLCC orderbook (dwt) also retains marginal significance in Model 2. The full estimated coefficients, standard errors, t-statistics, and p-values are presented in Tables 2 and 3.
| Variable | Estimate | Std. error | t-stat | p-value |
|---|---|---|---|---|
| Intercept | 0.0008 | 0.002 | 0.496 | 0.620 |
| VLCC scrap value (VLCC_SCR) | −0.047 | 0.020 | −2.407 | 0.017* |
| Suezmax secondhand price (SUEZ_SH) | −0.656 | 0.044 | −14.788 | 3.0 × 10⁻³⁶*** |
| ECT, VLCC scrap value | −0.351 | 0.086 | −4.101 | 6.0 × 10⁻⁵*** |
| ECT, Coated Panamax NB price | 0.485 | 0.128 | 3.795 | 0.0002*** |
| ECT, Suezmax secondhand price | −0.260 | 0.065 | −3.978 | 9.0 × 10⁻⁵*** |
Note. ECT = Error Correction Term. * p < 0.05, ** p < 0.01, *** p < 0.001. R² = 0.549, Adjusted R² = 0.540, F = 62.6, p < 0.001. Source: author's computations using Clarkson's data.
| Variable | Estimate | Std. error | t-stat | p-value |
|---|---|---|---|---|
| Intercept | −0.007 | 0.007 | −1.103 | 0.273 |
| Suezmax secondhand price (SUEZ_SH) | −0.537 | 0.054 | −9.924 | 2.0 × 10⁻¹⁵*** |
| Aframax fleet development (AFRA_FDL_DWT) | 1.222 | 0.514 | 2.378 | 0.020* |
| World steel production (WORLD_STL_PRO) | −0.375 | 0.077 | −4.889 | 5.0 × 10⁻⁶*** |
| Crude Aframax fleet growth (AFRA_CRUDE_FLG) | −0.101 | 0.036 | −2.789 | 0.007** |
| ECT, Suezmax secondhand price | −0.148 | 0.041 | −3.639 | 0.0005*** |
Note. ECT = Error Correction Term. * p < 0.05, ** p < 0.01, *** p < 0.001. R² = 0.682, Adjusted R² = 0.661, RMSE = 0.0394, F = 33.8, p < 0.001. Source: author's computations using Clarkson's data.
4.4 Cointegration and Residual Diagnostics
The Engle–Granger procedure confirms a long-run cointegration relationship between the dependent variable and the retained regressors in both models: the residuals are stationary at the first difference and the Error Correction Terms are significant at the 5 per cent level. ARMA terms are not significant in either specification and are dropped. The Jarque–Bera test indicates non-normal residuals in both models, prompting the inclusion of 22 dummy variables in Model 1 and 2 dummy variables in Model 2 to address influential observations. Model 1 satisfies homoscedasticity (no ARCH effect) and exhibits no serial correlation (Breusch–Godfrey, 14 lags), thereby meeting the Gauss–Markov conditions without further correction. Model 2 exhibits heteroskedasticity with an ARCH effect (but no serial correlation), to which White's correction is applied. Both models pass the Ramsey RESET test for functional form (p = 0.481 for Model 1; p = 0.889 for Model 2), confirming the linear specification.
4.5 Model Selection
Model 1 (monthly) yields adjusted R² = 0.540, AIC = −1192.6, BIC = −1711, and CAIC = −1165. Model 2 (quarterly) yields adjusted R² = 0.661, AIC = −302.9, BIC = −288.3, and CAIC = −282.3. The quarterly model explains approximately twelve percentage points more of the variation in the NB/SH ratio than the monthly model, with comparable diagnostic adequacy. The quarterly specification is therefore preferred for inference, and the discussion in Section 5 is anchored on Model 2 with Model 1 used for cross-validation.
5. Discussion
Five variables emerge as economically and statistically significant determinants of the VLCC NB/SH price ratio: VLCC scrap value, Suezmax secondhand price, Aframax fleet development, world steel production, and crude Aframax fleet growth. The sub-sections below interpret each in turn, attending to the economic logic, the implied decision rule for investors, and the relation of each finding to the prior literature. The objective is not merely to enumerate effects but to demonstrate how the cointegration evidence speaks to substantive debates in maritime economics concerning the interaction of fleet dynamics, commodity-input markets, and intra-class price spillovers.
5.1 VLCC Scrap Value
The VLCC scrap value carries a coefficient of −0.047 in Model 1, with an Error Correction coefficient of −0.351, indicating a stable long-run cointegration relationship: a one per cent rise in VLCC scrap value compresses the NB/SH ratio by approximately 4.7 per cent, making secondhand VLCCs relatively more expensive than newbuildings. The economic interpretation is direct: rising scrap values reflect a tightening secondhand market — demolition activity raises the floor under secondhand prices by reducing fleet supply, lifting freight rates, and improving the profitability of operating tonnage. Investors therefore have an incentive to acquire secondhand VLCCs when scrap values are rising and to divest as scrap values decline (Karlis & Polemis, 2016). This finding extends Karlis and Polemis' (2016) qualitative observation by quantifying the cointegration relationship with the NB/SH ratio.
5.2 Suezmax Secondhand Price
The Suezmax secondhand price is the single most powerful determinant of the VLCC NB/SH ratio in both models: a coefficient of −0.656 in Model 1 and −0.537 in Model 2, both significant at the 0.001 level. A one per cent rise in Suezmax secondhand price compresses the NB/SH ratio by 65.6 per cent in Model 1 and 53.7 per cent in Model 2 — making VLCC secondhand vessels relatively more attractive. The economic logic operates through the substitutability of large-class crude tankers: when Suezmax secondhand prices rise, the implied secondhand premium for the next size class up (VLCC) compresses, signalling that secondhand tonnage as a whole commands a market premium. Operationally, secondhand VLCCs are also deployable within weeks, against the eighteen-to-twenty-four-month delivery horizon characteristic of newbuildings (Dai et al., 2015). The magnitude of the coefficient is consistent with the now-classical proposition that secondhand vessel prices exhibit substantially greater short-run flexibility than newbuilding prices, with the latter being constrained by shipyard cost structures and orderbook lead times (Beenstock & Vergottis, 1989). Haralambides et al. (2005) qualify this picture by emphasising that newbuilding prices are themselves driven primarily by cost-side rather than demand-side factors; on the present account, the cointegration evidence is consistent with both views once the long-run adjustment captured by the ECT is taken into account.
5.3 Aframax Fleet Development
Aframax fleet development carries the only positive significant coefficient in Model 2 (1.222, p = 0.020), indicating that a one per cent expansion of the Aframax fleet pushes the NB/SH ratio upward by 122 per cent over the long run. The economic interpretation is that Aframax fleet expansion reflects a broader bullish outlook on crude transport that simultaneously raises the relative price of VLCC newbuildings (as shipyard capacity is committed and steel demand rises) more than it raises VLCC secondhand prices. For investors, periods of strong Aframax fleet growth therefore favour newbuilding investment: the longer asset life and the compliance advantages of newer tonnage — IMO 2020 sulphur cap compliance, improved energy efficiency, EEDI and CII compliance — yield superior long-run returns despite higher initial outlay (Tokuslu, 2020).
5.4 World Steel Production
World steel production enters Model 2 with a coefficient of −0.375 (p < 0.001) and is the third-strongest determinant of the NB/SH ratio. A one per cent rise in world steel production compresses the NB/SH ratio by 37.5 per cent, favouring secondhand VLCCs. The mechanism operates on both sides of the market: rising steel production signals industrial expansion and therefore stronger crude demand, lifting freight rates and benefiting available (i.e., secondhand) tonnage; concurrently, although steel is also the principal input to newbuilding construction (Mulligan, 2008), the demand-side effect dominates in the cointegration relationship. Investors should therefore weight world steel production as a leading indicator of secondhand-favouring conditions, and conversely treat falling steel output as a signal to delay secondhand acquisitions or to divest.
5.5 Crude Aframax Fleet Growth
Crude Aframax fleet growth (per cent per year) enters Model 2 with a coefficient of −0.101 (p = 0.007). A one per cent annual increase in Aframax fleet growth compresses the NB/SH ratio by 10.1 per cent, again favouring secondhand VLCCs. The interpretation is closely related to that of Aframax fleet development: fleet expansion at the Aframax tier signals industry-wide bullish positioning that benefits operational tonnage. The smaller coefficient relative to Aframax fleet development (dwt) reflects that growth rates carry less informational content than absolute fleet capacity for the NB/SH spread, but the relationship is statistically robust.
5.6 Integrated Decision Rule
The five determinants converge on a coherent decision rule. For
newbuilding decisions, Aframax fleet development is the single most informative leading indicator (positive coefficient): periods of fleet expansion across the Aframax class are favourable windows for newbuilding investment. For secondhand decisions, a combined signal from Suezmax secondhand price (rising), VLCC scrap value (rising), world steel production (rising), and Aframax fleet growth (rising) identifies favourable windows for secondhand acquisition; the reverse signal indicates favourable conditions for divestment. The Error Correction Terms confirm that deviations from this long-run equilibrium correct within the data frequency of the model, lending confidence to the use of the NB/SH ratio as a real-time decision indicator.
6. Implications
6.1 Theoretical Implications
This study contributes to the maritime economics literature in three ways. First, it operationalises Real Options Theory (Dixit & Pindyck, 1994) empirically in the VLCC market by treating the NB/SH price ratio as a deferral-value indicator: the ratio's deviation from its long-run cointegration equilibrium quantifies the value of waiting versus investing. Second, it extends the lead–lag literature on newbuilding–secondhand price dynamics (Kou et al., 2014; Tsolakis et al., 2003) by showing that the NB/SH ratio is itself driven by an identifiable set of macro- and fleet-side cointegrated variables — a structural rather than purely reduced-form result. Third, it provides direct empirical confirmation, in the VLCC class, of the structural-lag pattern that Alizadeh and Nomikos (2009) and Kavussanos (2015) identify across tanker markets more generally.
6.2 Practical and Policy Implications
For shipowners, charterers, and the financial institutions that finance them, the study yields actionable rules. Three are worth stating explicitly.
-
Track the NB/SH ratio against the five cointegrated variables as a leading indicator. A composite signal combining Aframax fleet development (for the newbuilding decision) and the four secondhand-favouring variables provides timing information that single-variable indicators do not.
-
Prefer the quarterly frequency for decision-relevant monitoring. The quarterly model materially outperforms the monthly one (adjusted R² = 66.1% vs. 54.0%); higher-frequency monitoring carries the noise without the additional information.
-
Sequence retrofit and compliance investments by signal. Where the composite signal favours newbuilding, the additional capital cost is partly offset by IMO 2020 sulphur-cap compliance, EEDI/CII performance, and longer remaining life. Where the signal favours secondhand, immediate deployability and lower capital outlay dominate. The decision is not whether to invest but when and which.
For policymakers and lenders, the findings imply that fleet-development data (Aframax tier in particular) should be tracked as systemic-risk indicators alongside oil-price and interest-rate aggregates, since fleet expansion at the Aframax tier carries leading information about the VLCC newbuilding cycle and therefore about the build-out of long-life capital that will determine the sector's emissions trajectory through the 2040s.
7. Limitations and Future Research
Four limitations should temper interpretation. First, the original research design envisaged three models (monthly, quarterly, and annual); data inconsistency in the annual series compelled exclusion of the annual model, leaving the cross-validation between the two retained models without an independent third check. Second, Model 2's small sample (n = 85) and reliance on White's correction means the standard errors should be interpreted with the caution standard to short-sample heteroskedasticity-corrected inference. Third, the data terminate in mid-2021, before the post-pandemic freight-rate spike of 2022–2023 and before the post-IMO-2023-Strategy compliance investments — both of which may have shifted the cointegration relationships materially. Fourth, the study examines a single tanker class. Future work should re-estimate the cointegration relationships through the post-2021 period, extend the analysis to Suezmax, Aframax, and Panamax classes, and test whether the same macroeconomic and fleet-side variables retain explanatory power for newer asset classes such as LNG carriers and offshore floating storage. Integrating machine-learning prediction onto the cointegration backbone is a further productive direction.
8. Conclusion
Investment in the VLCC tanker market is determined by the interaction of vessel-side, fleet-side, macroeconomic, and financial variables, and the timing decision is, in this asset class as in few others, the single most consequential source of value or loss across the capital cycle. Building on the now-substantial maritime econometrics literature (Beenstock & Vergottis, 1989; Stopford, 2009; Adland & Cullinane, 2006; Kavussanos & Visvikis, 2006), this study has constructed two OLS cointegration models on monthly (n = 263) and quarterly (n = 85) data spanning January 1999 to June 2021, and has identified five variables — VLCC scrap value, Suezmax secondhand price, Aframax fleet development, world steel production, and crude Aframax fleet growth — that exhibit stable long-run cointegration relationships with the VLCC newbuilding-to-secondhand price ratio. Aframax fleet development emerges as the principal leading indicator for newbuilding investment; the other four variables jointly drive the secondhand decision. The quarterly-frequency specification outperforms the monthly one substantively. The paper's contribution, on the present account, is to convert these statistical relationships into a transferable decision rule for shipowners, charterers, and lenders: not a forecast of vessel prices, but a framework for identifying the moments at which the market favours one investment posture over the other. In a sector where the wrong call can absorb a decade of free cash flow, that is the more useful instrument.
Declarations
Funding
The author received no specific funding for this work.
Conflict of Interest
The author declares no competing financial interests or personal relationships that could have influenced the work reported in this paper.
Data Availability
Raw time-series data are commercially licensed from Clarkson's Shipping Intelligence Network. Estimated coefficients, MATLAB code, and diagnostic outputs supporting the findings are available from the author on reasonable request, subject to Clarkson's data-use terms.
Author Contributions (CRediT)
E. M. Burchard: Conceptualisation, Methodology, Software, Formal analysis, Investigation, Data curation, Writing — original draft, Writing — review & editing, Visualisation.
Acknowledgements
The author thanks Clarkson's Shipping Intelligence Network for data access, and colleagues at the National Institute of Transport for comments on earlier drafts.
Disclosure of AI-Assisted Editing
During the preparation of this manuscript, the author used an AI-based large language model (Claude, Anthropic) to assist with language editing, structural revision, and proofreading. After using this tool, the author reviewed and edited the content as required and takes full responsibility for the content of the publication. The data, sample, methodology, analytical procedures, and findings were not generated or altered by this tool.
References
- Abebe, T. H. (2019). The derivation and choice of appropriate test statistic (z, t, F, and chi-square test) in research methodology. Journal of Mathematics Letters, 5(3), 33–40. DOI ↗ Google Scholar ↗
- Adland, R., & Cullinane, K. (2006). The non-linear dynamics of spot freight rates in tanker markets. Transportation Research Part E: Logistics and Transportation Review, 42(3), 211–224. DOI ↗ Google Scholar ↗
- Alexandridis, G., Kavussanos, M. G., Kim, C. Y., Tsouknidis, D. A., & Visvikis, I. D. (2018). A survey of shipping finance research: Setting the future research agenda. Transportation Research Part E: Logistics and Transportation Review, 115, 164–212. DOI ↗ Google Scholar ↗
- Alizadeh, A. H., & Nomikos, N. K. (2004). Cost of carry, causality and arbitrage between oil futures and tanker freight markets. Transportation Research Part E: Logistics and Transportation Review, 40(4), 297–316. DOI ↗ Google Scholar ↗
- Alizadeh, A. H., & Nomikos, N. K. (2006). Trading strategies in the market for tankers. Maritime Policy & Management, 33(2), 119–140. DOI ↗ Google Scholar ↗
- Alizadeh, A. H., & Nomikos, N. K. (2009). Shipping derivatives and risk management. Palgrave Macmillan. DOI ↗ Google Scholar ↗
- Austin, D. W. (2010). Comparative feasibility investment study between newly built and second-hand post-Panamax container vessels [Master's thesis, Erasmus University Rotterdam]. DOI ↗ Google Scholar ↗
- Beenstock, M., & Vergottis, A. R. (1989). An econometric model of the world tanker market. Journal of Transport Economics and Policy, 23(2), 263–280. DOI ↗ Google Scholar ↗
- Chen, S., & Chang, M. (2006). Relative prices and expenditure switching effect. Applied Economics, 38(17), 2069–2073. DOI ↗ Google Scholar ↗
- Cheng, L., & Duran, M. A. (2004). Logistics for world-wide crude oil transportation using discrete event simulation and optimal control. Computers & Chemical Engineering, 28(6–7), 897–911. DOI ↗ Google Scholar ↗
- Dai, L., Hu, H., & Zhang, D. (2015). An empirical analysis of freight rate and vessel price volatility transmission in global dry bulk shipping market. Journal of Traffic and Transportation Engineering (English Edition), 2(5), 353–361. DOI ↗ Google Scholar ↗
- Daoud, J. I. (2017). Multicollinearity and regression analysis. Journal of Physics: Conference Series, 949, 012009. DOI ↗ Google Scholar ↗
- Dixit, A. K., & Pindyck, R. S. (1994). Investment under uncertainty. Princeton University Press. DOI ↗ Google Scholar ↗
- Fan, L., & Luo, M. (2013). Analyzing ship investment behaviour in liner shipping. Maritime Policy & Management, 40(6), 511–533. DOI ↗ Google Scholar ↗
- Haralambides, H. E., Tsolakis, S. D., & Cridland, C. (2005). Econometric modelling of newbuilding and secondhand ship prices. Research in Transportation Economics, 12(1), 65–105. DOI ↗ Google Scholar ↗
- Harris, R. I. D. (1995). Using cointegration analysis in econometric modelling. Prentice Hall. <211::aid-jae398>3.0.co;2-8 DOI ↗ Google Scholar ↗
- Karlis, T., & Polemis, D. (2016). Ship demolition activity: A monetary flow process approach. Pomorstvo, 30(2), 128–132. DOI ↗ Google Scholar ↗
- Kavussanos, M. G. (2015). The future of shipping finance: A review and an outlook. Maritime Economics & Logistics, 17, 1–20. DOI ↗ Google Scholar ↗
- Kavussanos, M. G., Strandenes, S. P., & Thanopoulou, H. (2022). Ends of eras and new beginnings: Twenty-first century challenges for shipping. Maritime Economics & Logistics, 24(2), 347–367. DOI ↗ Google Scholar ↗
- Kavussanos, M. G., & Visvikis, I. D. (2006). Shipping freight derivatives: A survey of recent evidence. Maritime Policy & Management, 33(3), 233–255. DOI ↗ Google Scholar ↗
- Kou, Y., Liu, L., & Luo, M. (2014). Lead–lag relationship between new-building and second-hand ship prices. Maritime Policy & Management, 41(4), 303–327. DOI ↗ Google Scholar ↗
- Krugman, P. R. (1979). Increasing returns, monopolistic competition, and international trade. Journal of International Economics, 9(4), 469–479. DOI ↗ Google Scholar ↗
- Lambey, R. Q. (2020). Modelling the investment decision in the dry bulk sector: The choice of a second-hand vessel versus a newly built vessel [Master's thesis, World Maritime University]. WMU Library. DOI ↗ Google Scholar ↗
- Lee, B. S., & Rui, O. M. (2002). The dynamic relationship between stock returns and trading volume: Domestic and cross-country evidence. Journal of Banking & Finance, 26(1), 51–78. DOI ↗ Google Scholar ↗
- Luo, M. (2015). The relationship between newbuilding and second-hand vessel prices in the bulk shipping market. Transportation Research Part E: Logistics and Transportation Review, 78, 1–15. DOI ↗ Google Scholar ↗
- Merikas, A. G., Merika, A. A., & Koutroubousis, G. (2008). Modelling the investment decision of the entrepreneur in the tanker sector: Choosing between a second-hand vessel and a newly built one. Maritime Policy & Management, 35(5), 433–447. DOI ↗ Google Scholar ↗
- Mulligan, R. F. (2008). A simple model for estimating newbuilding costs. Maritime Economics & Logistics, 10(3), 310–321. DOI ↗ Google Scholar ↗
- Ohlin, B. (1933). Interregional and international trade. Harvard University Press. DOI ↗ Google Scholar ↗
- Ricardo, D. (1817). On the principles of political economy and taxation. John Murray. DOI ↗ Google Scholar ↗
- Stasinopoulos, P. (2015). Return on investment in newly built and second-hand vessels and portfolio risk management in shipping: The case of equity-financed bulkers and tankers [Master's thesis, Erasmus University Rotterdam]. DOI ↗ Google Scholar ↗
- Stopford, M. (2009). Maritime economics (3rd ed.). Routledge. DOI ↗ Google Scholar ↗
- Talley, W. K., & Ng, M. (2013). Maritime transport chain choice by carriers, ports and shippers. International Journal of Production Economics, 142(2), 311–316. DOI ↗ Google Scholar ↗
- Tinbergen, J. (1962). Shaping the world economy: Suggestions for an international economic policy. The Twentieth Century Fund. DOI ↗ Google Scholar ↗
- Tokuslu, A. (2020). Estimating exhaust gas emissions from ships on port of Zonguldak. International Journal of Environmental Pollution and Environmental Modelling, 3(2), 49–55. DOI ↗ Google Scholar ↗
- Tsolakis, S. D., Cridland, C., & Haralambides, H. E. (2003). Econometric modelling of second-hand ship prices. Maritime Economics & Logistics, 5, 347–377. DOI ↗ Google Scholar ↗
- United Nations Conference on Trade and Development. (2020). Review of maritime transport 2020. United Nations. DOI ↗ Google Scholar ↗
- United Nations Conference on Trade and Development. (2021). UNCTAD handbook of statistics 2021 — Maritime transport. United Nations. DOI ↗ Google Scholar ↗
- United Nations Conference on Trade and Development. (2024). Review of maritime transport 2024 — Chapter II: World shipping fleet and services. United Nations. DOI ↗ Google Scholar ↗
- Veenstra, A. W. (1999). The term structure of ocean freight rates. Maritime Policy & Management, 26(3), 279–293. DOI ↗ Google Scholar ↗
- Xu, J. J., Yip, T. L., & Liu, L. (2011). A directional relationship between freight and newbuilding markets: A panel analysis. Maritime Economics & Logistics, 13(1), 44–60. DOI ↗ Google Scholar ↗
- Zeng, Y. (2017). Introductory econometrics for finance: Book summary (pp. 13–14). DOI ↗ Google Scholar ↗
Appendix
A. Variable Definitions
Table A1 lists all independent and control variables used in Model 1 (monthly) and Model 2 (quarterly), with their OLS abbreviations, descriptions, and units. Source: Clarkson's Shipping Intelligence Network and ancillary sources noted.
| OLS code | Description | Unit |
|---|---|---|
| G_OIL_PROD | Global crude oil production | mbpd |
| WORLD_STL_PRO | World steel production | 000′ t |
| INDUST_CHINA | Industrial production, China | % |
| INDUST_EU | Industrial production, Europe | % |
| VLCC_DEMOL | VLCC demolition (scrapping volume) | dwt |
| VLCC_SCR | VLCC scrap value | US$ M |
| SUEZ_SH | Suezmax double-hull 160,000 dwt 5-year-old secondhand price | US$ M |
| SUEZ_NB | 156–158,000 dwt Suezmax tanker newbuilding price | US$ M |
| PANA_NB | Coated Panamax tanker newbuilding price (73–75,000 dwt) | US$ M |
| AFRA_FDL_DWT | Aframax tanker fleet development | dwt M |
| AFRA_OBK_dwt | Aframax crude tanker (85–124,999 dwt) orderbook | dwt |
| C_AFRA_FLGROWTH | Crude Aframax fleet growth rate | % / yr |
| VLCC_FL_DEV | VLCC fleet development (number of vessels) | no. |
| UL_VLCC_OBK_dwt | ULCC / VLCC orderbook | dwt |
| SUEZ_OBK_dwt | Suezmax crude tanker (120–199,999 dwt) orderbook | dwt |
| AV_VLCC_EARN | Average VLCC long-run historical earnings | $/day |
| AV_SUEZ_EARN | Average Suezmax long-run historical earnings | $/day |
| HSFO_SINGAPORE | HSFO 380 cst (3.5% sulphur) bunker price, Singapore | $/tonne |
| BRENT_CRUDE | Brent crude oil price (control variable) | $/bbl |
| LIBOR_LONDON | LIBOR interest rate (control variable) | % |
| EX_SDR | SDR exchange rate (control variable) | USD |
Note. Italicised rows are control variables. Dwt = deadweight tonnage; mbpd = million barrels per day; SDR = Special Drawing Rights.
Appendix B. OLS Regression Procedure
The estimation procedure followed is depicted in Figure B1. It consolidates the principal steps used in this study: defining the variables, computing descriptive statistics, testing for unit roots and multicollinearity, applying significance tests, performing the Engle–Granger cointegration procedure, conducting residual diagnostics, and applying robust corrections where required.
