
Abstract
This study analyses the productivity of Zanzibar port from 2015 to 2025. Specifically, it aims to determine trends in cargo throughput and vessel calls, examine the drivers of port productivity, and assess the overall productivity of Zanzibar port. The analysis is motivated by the limited empirical evidence on small island ports and the need to determine whether productivity growth is driven by technological advancement or efficiency improvements. Using Data Envelopment Analysis–Malmquist Productivity Index (DEA-MPI), the study decomposes total factor productivity into efficiency change and technological change. The study reveals a fluctuating yet generally increasing trend in cargo throughput and vessel calls at Zanzibar Port, reflecting evolving trade patterns and capacity pressures in Zanzibar. However, the productivity analysis revealed that Efficiency change remained constant throughout the study period (EC=1), demonstrating a lack of catch-up effects and no measurable improvement in relative operational efficiency. Consequently, total factor productivity seemed to be driven by technological change, which exhibits significant volatility over time. These findings challenge the conventional perspective that port productivity growth is jointly driven by technology and efficiency, instead highlighting a technology-dominant growth pattern in the context of developing ports like Zanzibar Port. The analysis suggests that investment without corresponding efficiency improvements may impede the sustainability of productivity growth. This paper contributes to the port performance literature by offering new empirical evidence from a small island port and presenting a nuanced decomposition of productivity dynamics. From a policy perspective, the findings emphasize the necessity of an integrated approach that combines technological upgrades with efficiency-enhancing reforms and institutional strengthening to achieve stable and sustainable productivity growth at Zanzibar Port.
Keywords
Port Productivity DEA-MPI Efficiency Change Technological Change Small Island Seaports.
1. Introduction
Ports are critical nodes in global supply chains, facilitating the movement of goods and connecting economies worldwide. As pivotal hubs of trade and commerce, ports serve as interfaces between land and sea, enabling the efficient transfer of cargo across continents (Ducruet & Lee, 2019). Cargo entering and leaving ports is estimated at over 11 billion tons and accounts for more than 90% percent of goods traded globally (Nottteboom &Pallis,2021).
The operational efficiency of ports influences the speed of cargo movement, logistics costs, and overall trade competitiveness of the country. In recent years, due to increasing globalisation and rising trade volumes, ports have faced pressure to improve productivity, reduce congestion, and enhance service reliability. As a result, port performance has become a main concern for port authorities, policymakers, and researchers, particularly regarding its importance in reducing maritime transport costs and supporting economic growth (Notteboom & Rodrigue, 2019; Ducruet& Notteboom, 2023)
Global port performance declined between 2020 and 2024 due to the Red Sea Crisis, disruptions at the Panama Canal, and pandemic-related shocks. An average of some 2 million TEUs of cargo was delayed or stalled in 2024, the highest since 2022 (World Bank &S&P Global Market Intelligence,2025). Despite these challenges, efficiency gains were uneven across regions and income levels. North America and Europe experienced the greatest impact from the COVID-19 pandemic, as North American ports posted the lowest CPPI scores worldwide in 2022. The Red Sea experienced the harshest effects of the crisis, witnessing an 85% decline in the average number of deep-sea port visits in 2024. East Asian ports led the 2024 efficiency rankings, with major hubs such as Shanghai and Singapore retaining top positions (Sea-Intelligence, 2024). Meanwhile, ports in developing regions, including South Asia and West Africa, demonstrated significant improvements (International Bank for Reconstruction and Development, 2024).
In Africa and other developing countries, many ports are lagging in operational efficiency due to structural and operational constraints such as limited technological adoption, low cargo throughput, high logistics costs, inadequate infrastructures, and inefficient cargo handling systems (UNCTAD, 2024; World Bank,2025). These challenges significantly affect their ability to compete with more efficient global ports. Studies revealed that, while demand is a factor, differences in productivity across regions are heavily driven by technological factors, investment scale, and management practices (Humphreys et al., 2019)
In Zanzibar, Malindi Port is the main entry point for passengers and international trade to the island. Approximately 95% of cargo entering Zanzibar passes through this port. Malindi Port also has the busiest passenger terminal in the East African region, handling an average of 1.5 million passengers per year (ZPC,2026). The port has one berth for large foreign-going vessels with a quay length of 240 metres and another berth for coasters with a length of 113 metres. It can accommodate first-generation container vessels with a draught of up to 10 metres. (Mwinyi et al., 2024). Despite its strategic location in the Indian Ocean trade corridor, Malindi Port has historically struggled with congestion, vessel delays, cargo handling constraints, and infrastructure limitations. These challenges hinder its potential to fully support regional trade growth and integration within East African maritime networks. Yet the Revolutionary Government of Zanzibar is currently undergoing a major transformation to address these challenges. Major public-private partnership and new construction projects are underway to position Zanzibar as a regional maritime hub. Understanding and evaluating the efficiency level of this port is therefore essential for informing strategic interventions aimed at improving Zanzibar Port performance (Kombo, 2015; Mwinyi et al., 2024; The Challenges Facing the Ports in ESA, n.d. ;Jumbe & Mamboya, 2019)
(Source: World Bank 2018, & ZPC,2026)
Traditionally, port performance assessment methods heavily relied on indicators such as throughput or turnaround time, which do not fully address the dynamic nature of port productivity (UNCTAD,1976). To capture these constraints, advanced efficiency measurement techniques such as Data Envelopment Analysis (DEA) and the Malmquist Productivity Index (MPI) have been widely applied in port efficiency studies. These methods allow for the evaluation of efficiency over time between firms and decomposing total productivity changes into technological change and efficiency change. This provides a more comprehensive view of performance dynamics (Färe et al., 2012; Førsund, 1990).
Although DEA-MPI has been increasingly applied in global port research, few studies have utilised these advanced analytical tools to assess archipelagic state ports such as Zanzibar Port. Most existing research has focused on descriptive performance analysis. Consequently, a significant research gap remains in understanding the efficiency and productivity of Zanzibar Port over time.
Therefore, this study aims to use the Malmquist productivity index DEA approach to analyse the Productivity of Zanzibar Port (Malindi Port). The study will provide empirical evidence on efficiency trends, drivers of port productivity, and overall productivity change, thereby contributing to improved decision-making and policy formulation in port management and maritime logistics development.
2. Literature Review
2.1 Conceptual Definitions
2.1.1 Port Performance
Performance is defined as the execution of port activities in a way that achieves targets established by owners and service providers while also fulfilling the expectations of port customers (Notteboom et al., 2021b; Van Hassel et al., 2024). The overall port performance can be attained by ensuring that port operations are improved through optimising port capacity (Burns, 2014; Safuan, 2025). The concept of port performance comprises three key components: efficiency, effectiveness, and resilience to disruptions, with resilience being a relatively recent addition to this framework, recognised as an essential element (Notteboom et al., 2021b).
2.1.2 Port Operational Efficiency
It is an ability of the port to utilise available resources such as infrastructure, handling equipment, and labour to maximise outputs in terms of cargo throughput, ships handled, and service quality (Notteboom et al., 2021a). An efficient port reduces logistics costs, minimises operational delays, and enhances overall port logistics performance. Port efficiency is an important determinant of competitiveness in maritime trade, as it directly affects turnaround time, cargo dwell time, and shipping costs (Cullinane, 2026).
2.1.3 Port Effectiveness
Effectiveness assesses how well the firm or agency uses its strategies, structures, and tasks to achieve its mission and stated goals. For an effectiveness-oriented port authority, if one of the goals is profit-maximising, there will be a companion goal of developing and retaining customers who generate the greatest margins while not servicing those that are not profitable. Effectiveness in delivering users using the services they desire is linked to port competitiveness. The services that customers value and continue to use on the port are known as desired services. Dissatisfaction results from a negative and substantial discrepancy between the importance of projected services and their performance, which may affect port revenue and customer retention (Ducruet & Notteboom, 2023; Notteboom et al., 2026)
2.1.4 Port Productivity
Port productivity refers to how well a port utilises its resources, such as labour, handling equipment, and infrastructure, to handle cargo and vessels within a given period. It is normally assessed using operational indicators such as ship turnaround time, berth occupancy rate, moves per hour, and cargo throughput. An effective method to evaluate port productivity is through benchmark tools like CPPI, developed by the World Bank (United Nations Conference on Trade and Development, 2025). Based on that, the port with lower vessel turnaround time and higher operational efficiency ranks better, which reflects a higher productivity level (The Container Port Performance Index 2020 to 2024, n.d.). Moreover, productivity can also be evaluated using total factor productivity, which considers multiple inputs such as capital, technology, and labour. This approach explains how well a port can change its resources into services (Cullinane, 2026; Dudycz et al., 2015; Yu, 2024).
2.1.5 Port Resilience
Port resilience refers to the capability to sustain a reasonable level of service despite disruptions such as pandemics, natural disasters, or cyber and terrorist attacks; this varies according to the port's size, location, and operational type. The resilience of ports is primarily influenced by their capacity to stay operational and provide services and infrastructure to vessels, cargo, and other clients even amid disruptions (UNCTAD,2025; Notteboom et al,2026)
2.2 Empirical Review
Various techniques have been utilised to evaluate the operational effectiveness of ports, highlighting the intricate nature of the logistics chain and port production systems. Among these techniques, Stochastic Frontier Analysis (SFA) is one of the most employed parametric methods. Research conducted by Liu (1995), Coto-Millan et al., 2000; Liu (1995), Chen et al. (n.d.), and Sánchez et al. (2003) applied SFA to estimate port efficiency by concentrating on the production frontier. Recent studies continue to utilise SFA for evaluating port performance across different regions, indicating variations in efficiency associated with infrastructure management (Diallo et al., 2022)(周玉涛 et al., 2024) ,(Ben Mabrouk & Aloulou, 2025), and (Almeida et al., 2026). However, SFA significantly relies on assumptions related to the functional form and error distribution, which adds a layer of subjectivity and constrains its use in complex port settings where such assumptions may be challenging to validate (Schmidt, 1985; Schmidt & Sickles, 1984)
Nonparametric methods, particularly Data Envelopment Analysis (DEA), have gained prominence due to their capability and flexibility in addressing multiple inputs and outputs without requiring a predefined functional form. DEA establishes an efficiency frontier based on observed data to evaluate the relative efficiency of decision-making units. Initial studies by(Roll and Hayuth 1993; Wang et al. 2003) identified DEA-model as an appropriate technique for analyzing port efficiency. More recent research has validated its ongoing significance; for example, studies conducted in Asia and Europe have effectively captured operational variances shaped by labor, infrastructure, handling equipment, and cargo volume. Sun, J. (2017) utilized an extended DEA analysis to assess the performance of Chinese port enterprises with environmental considerations in mind. Kuo Chen (2020) utilized a DEA model to investigate the performance and competitiveness of 53 ports in Vietnam and to forecast their future performance. Lin Yang (2019) employed the inverse DEA method to examine performance evaluation and investment analysis for sustainable development in China's container ports. Similarly, Choi Yang (2022) used SBM – DEA to evaluate the efficiency of major container terminals in the top three cities of the Pearl River Delta during the years 2018-2019. Additionally, Rabeb & Chokri (2022) assessed and measured the efficiency and competitiveness of seaports throughout Europe.
To address the dynamic nature of port performance, studies have increasingly integrated DEA with the Malmquist Productivity Index (MPI). The DEA-MPI approach allows for the measurement of productivity changes over time by decomposing total factor productivity into efficiency change and technological change. Recent studies highlight the application of this method.
For instance, Pham (2022) used DEA-MPI and found that technological progress is the main driver of productivity improvement in container ports, while efficiency change depends on managerial and operational practices. Similarly, Massami and Nyange (2025) reported that productivity gains at the Dar es Salaam Maritime Terminal were largely driven by technological advancement following institutional reforms. Chen et al. (2026) demonstrated that digitalization enhances cargo handling speed, coordination, and decision-making efficiency, thereby advancing technological progress within the DEA–MPI framework. Furthermore, Chand (2024) argued that productivity improvements in ports are primarily driven by the integration of smart technologies, automation systems, and data-driven port management, which collectively increase operational efficiency and competitiveness.
Empirical evidence demonstrates regional disparities in port efficiency. In Africa, studies have identified infrastructure constraints, institutional inefficiency, technological backwardness, and governance challenges as significant impediments to port performance. Recent analyses indicate that many African ports experience persistent inefficiency due to insufficient modernization and limited technological adoption (Osundiran, 2023, 2025; Ibeh, 2025). Studies in Asian Ports show productivity growth is strongly related to technological adoption, scale efficiency, and infrastructure modernization (Kim & Park, 2022; Park et al., 2022).
In Latin America, Gil-Ropero et al. (2021) found that ports with higher efficiency levels require infrastructure expansion to sustain growth, whereas less efficient ports face issues of underutilization. Collectively, these findings underscore the importance of both resource allocation and technological advancement in enhancing global port efficiency.
Although numerous analytical approaches exist, there is no consensus on a single optimal method for measuring efficiency (González & Trujillo, 2009; Tovar et al., 2007). The input-output oriented approach, particularly Data Envelopment Analysis (DEA) and DEA-based Malmquist Productivity Index (DEA-MPI), is widely regarded as the most suitable due to its capacity to capture the multi-dimensional aspects of port operations (Valentine & Gray, 2001). DEA facilitates benchmarking by identifying the best-performing port, while MPI measures productivity changes over time by decomposing technical and technological change. Therefore, a combined approach is considered highly appropriate for comprehensive efficiency analysis.
Nevertheless, there remains a limited application of DEA-MPI in the context of Zanzibari Port (Malindi Port). Most existing studies focus on large global or regional ports, with little attention given to small and medium-sized ports in developing countries. This study addresses this gap by applying the DEA-MPI approach to analyse the operational efficiency and productivity change of Zanzibar Port from 2015 to 2025, hence contributing to both academic literature and policy development in the Eastern African Maritime sector.
| References | Research Focus | Region | Method |
|---|---|---|---|
| Eruwan et al. (2023) | Regulatory governance and logistics efficiency in transport systems | Global ports | DEA–L (Data Envelopment Analysis – Logistic model) |
| Raju et al. (2023) | Productivity and operational efficiency in port operations | Indian and Sri Lankan ports | DEA–CCR, DEA–BCC, and DEA–Malmquist Productivity Index |
| Li (2022) | Container terminal operational efficiency and total factor productivity | China ports | DEA–SBM and DEA–MPI |
| Chand (2024) | Smart port technologies and productivity improvement | Asian ports | DEA–MPI integrated with digital transformation indicators |
| Pham (2022) | Port productivity dynamics and technological change | Southeast Asia | DEA–Malmquist Productivity Index |
| Massami & Nyange (2025) | Impact of port concession on productivity performance | Tanzania (Dar es Salaam Maritime Terminal) | DEA–MPI pre- and post-concession analysis |
| Danladi et al. (2025) | Institutional reforms and port efficiency dynamics | Lower-middle-income countries | DEA–MPI |
| Chen et al. (2026) | Digital transformation and container port productivity | Global ports | DEA–MPI |
| Osundiran (2023, 2025) | African port efficiency and structural constraints | Africa | DEA-based efficiency assessment |
| Ibeh (2025) | Port productivity and institutional inefficiencies | Africa | DEA comparative analysis |
| Alsuwaida (2020) | Measuring efficiency and productivity changes of seaports | Saudi Arabia | DEA–Malmquist Productivity Index (MPI) |
| Pham & Kim (2022) | Evaluating efficiency and productivity using dimensionality reduction techniques | South Korea | PCA–DEA |
| Chen & Tsai (2026) | Assessing resilience and efficiency of global container ports based on infrastructure and strategies | Global | DEA–Malmquist Index |
| Mishra (2025) | Performance evaluation of logistics hubs using combined efficiency techniques | Global/Multiple Regions | DEA, Modified DEA, Cross-efficiency |
| Osundiran (2023) | Examining the role of port efficiency in facilitating trade under AfCFTA | Africa | DEA (Conceptual/Empirical) |
| Matekenya & Siyanda (2025) | Measuring technical efficiency of ports within a regional customs union | Southern Africa (SACU) | DEA |
| Belgin & Apaydın Avşar (2026) | Evaluating performance and productivity change using hybrid forecasting and efficiency models | Türkiye | DEA–MPI–GMN |
Source: Author’s Fieldwork
3. Variables, Data and Method
3.1 Variables
Since the main function of a port is to handle cargo and its ships, three outputs were selected, and six variable inputs were considered by the author. After reviewing different studies of various scholars, the same factors/variables are highly recommended to measure the efficiency and productivity change, for example, (Joanna D, 2015; Zhang, 2021; Makiri M, 2019; Ian M, 2021; Mwendapole, 2022; Adeola et al., 2019); and (IDB, 2015).
Therefore, container throughput, general cargo throughput, and ship calls are the output variables used in this study to measure the efficiency of Zanzibar Seaport because these are used to measure a port terminal's efficiency (i.e., the amount of cargo handled by the port from which it produces its major income). Containers and general cargo throughput are utilised since they are the most used measurements for Port terminal productivity. It's also a metric used by all ports to determine how much trade is being done. (Makiri M, 2019)
Quay crane availability is a critical factor in container terminal capacity. More cranes enable servicing multiple vessels at the same time and increase cargo handling rates. Pjevčević et al. (2012) established this relationship. Recent studies show that not just the number of cranes, but also how they are allocated and their productivity play a significant role in terminal efficiency and throughput (Jiang et al., 2021; Makhado et al., 2025). The terminal area, the number of forklifts, and reach stackers are included in this study because they reflect yard-side productivity and are commonly used inside terminal areas (Osundiran,2020). Therefore, the port equipped with adequate handling equipment can be more efficient than one with insufficient handling equipment.
| INPUTS | OUTPUT |
| X1 =Terminal Area (ha) | Y1 = Container throughput |
| X2 =Draft (M) | Y2=General Cargo Throughput |
| X3 = Quay length (m) | Y3= Ship calls |
| X4= Number of berths | |
| X5=Number of Forklifts | |
| X6= Number of Reach stacker | |
| X7 =Number of Mobile Cranes |
Source: Author’s Fieldwork
3.2 Types of Data
Types of data determine the specific objective of the study (AL Iraqi et al, 2014). The data were obtained from ZPC official websites, CAG reports, and the International Data Centre. This part focuses on the input and output data used for the MPI analysis.
| INPUTS | OUTPUTS | ||||||||||
| Year | Terminal Area (ha) | Draft (M) | Quay length (m) | Number of berths | Number of Cranes | Reach stacker | Forklift | General cargo Tons | Ship calls | Container throughput | |
| 2015 | 0.29 | 10 | 240 | 1 | 1 | 2 | 2 | 371 | 142 | 75161 | |
| 2016 | 0.29 | 10 | 240 | 1 | 1 | 2 | 2 | 402 | 120 | 76787 | |
| 2017 | 0.29 | 10 | 240 | 1 | 1 | 2 | 2 | 446 | 174 | 73351 | |
| 2018 | 0.29 | 10 | 240 | 1 | 1 | 2 | 2 | 433 | 120 | 81146 | |
| 2019 | 0.29 | 10 | 240 | 1 | 1 | 2 | 2 | 391 | 124 | 82637 | |
| 2020 | 0.29 | 10 | 240 | 1 | 1 | 2 | 2 | 587 | 140 | 68707 | |
| 2021 | 0.29 | 10 | 240 | 1 | 2 | 2 | 2 | 1,112 | 126 | 70461 | |
| 2022 | 0.29 | 10 | 240 | 1 | 2 | 2 | 2 | 2,370 | 116 | 75185 | |
| 2023 | 0.29 | 10 | 240 | 1 | 2 | 2 | 2 | 2,176 | 125 | 81501 | |
| 2024 | 0.29 | 10 | 240 | 1 | 2 | 2 | 2 | 1,144 | 139 | 44611 | |
| 2025 | 0.29 | 10 | 240 | 1 | 2 | 2 | 2 | 3,034 | 262 | 91895 |
Source: Author’s Fieldwork
3.3 Methods
3.3.1 Efficiency Measurement Concept
The aim of the study was to analyse the efficiency and productivity level of Zanzibar Port (Malindi Port). There are several approaches available for evaluating a firm's efficiency/Productivity. The two primary and contemporary methods are Stochastic Frontier Analysis (SFA) and Data Envelopment Analysis (DEA) (Cooper et al. 2005). Among these methods, DEA has become increasingly prominent and holds significant importance in recent research(Yu 2024), as it integrates various inputs and outputs across different decision-making units (DMUs). Therefore, this study is based on DEA-MPI.
3.3.2Data Envelopment Analysis (DEA).
DEA is a technique used to assess relative or comparative efficiency. It is a non-parametric approach in operations research and economics aimed at estimating production frontiers (Bhat et al. 2001; Chand et al. 2024). This method is employed to empirically evaluate the productive efficiency of decision-making units (DMUs).
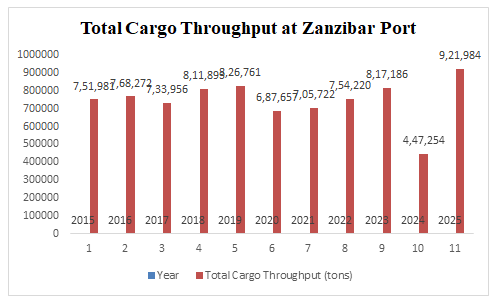
(Charnes A., W. Cooper and E. Rhodes 1978). Charnes, Cooper, and Rhodes (1978) had an input orientation and assumed continuous returns to scale (CRS). Then, Banker, Charnes, and Cooper (1984) introduced a variable return to scale (VRS) model, addressing alternative sets of assumptions. Hence, this model was the first to be extensively used. The variable returns-to-scale model, which is based on output orientation, is the one employed by the author for this study.
\
Source: Adopted from Coelli, T.J. (1996)
3.3.3 Malmquist Productivity Index
The Malmquist Productivity Index is a widely used method for measuring productivity change over time. Initially introduced by Malmquist, the total factor productivity index was later developed within the framework of Data Envelopment Analysis (DEA) (Førsund 1990; Färe et al. 2012). This index quantifies productivity change across time periods and can be decomposed into efficiency changes (catch-up effects) and technological changes (frontier shift effects). Therefore, the Malmquist Productivity Index is valuable for identifying industry trends and technological advancements. The output-based Malmquist productivity change index using VRS, as defined by Fare et al. (1994), is applied in this study.
The Malmquist equation, which is used to calculate efficiency and determine the drivers of port productivity, is constructed using the concept of efficiency change (EFCH) and technological change (TCH) as equation (1).
M = (EFCH) . (TCH) = [ ( D_(t+1)(x_(t+1), y_(t+1)) / D_t(x_t, y_t) ) \times ( D_t(x_t, y_t) / D_(t+1)(x_t, y_t) \times D_t(x_(t+1), y_(t+1)) / D_(t+1)(x_(t+1), y_(t+1)) ) ]^(1/2)
Eq .(1)
Where: x_t and x_(t+1) : input vectors of dimension N at time t and t+1 y_t and y_(t+1) : corresponding k - output vectors D_t and D_(t+1) denote an input distance function
Where: [D(x,y) = \max(\rho : s / \rho s \in L(y))]
The interpretation is as follows: L(y) represents the number of all input vectors with which a certain output vector y can be produced. \rho in equation (2) can be understood as a reciprocal value of the factor by which the total inputs could be maximally reduced without reducing output.
Hence, M : Measures the productivity change between periods t and t+1. Productivity declines if M < 1, remains unchanged if M = 1 and improves if M > 1.
4. Results And Discussion
This section presents an analysis and interpretation of data done through descriptive statistics and the DEA-Malmquist productivity index. The data range is from 2015 to 2025
4.1. Trends in Total Cargo Throughput for Malindi Port in Zanzibar between 2015 and 2025.
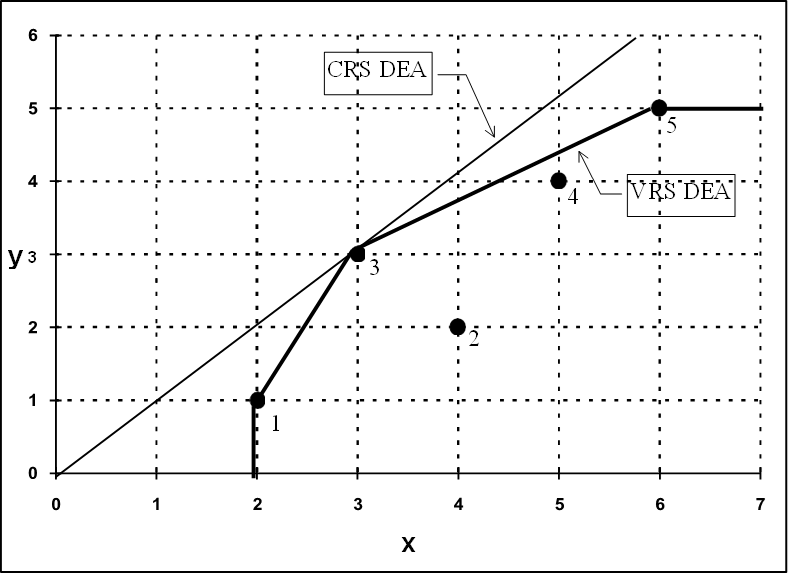
Between 2015 and 2023, total cargo throughput at Zanzibar Port (Malindi Port) demonstrated a notable upward trend with cyclical variations. This reflects a port system that is expanding yet remains sensitive to fluctuations. The years 2015-2019 indicate consistent growth, with cargo throughput rising from around 752,000 tons to 827,000 tons, largely fuelled by a steady increase in containerized cargo, while general cargo experienced minimal growth. In 2020, a significant decline was observed, likely due to the external impact of the COVID-19 pandemic, which disrupted trade flows. From 2021 to 2023, Zanzibar Port went through a robust recovery phase, with throughput increasing markedly and reaching a peak of over 817,000 tons, bolstered by both general cargo and container growth.
In 2024, there was a significant decline primarily due to a reduction in container volume, likely resulting from structural changes at Zanzibar port associated with an African Global logistics partnership. The trend reversed in 2025, with volumes rebounding to approximately 922,000 tons, the highest level recorded, driven by increased container traffic.
Source: Author’s Fieldwork
4.2. Trends in Various Cargo Types Throughput
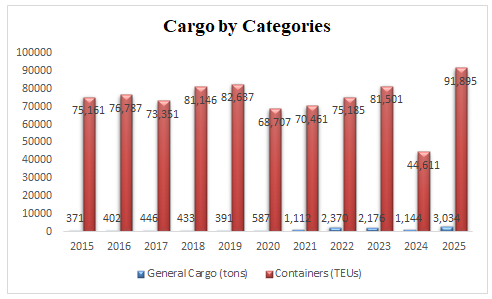
This section examines the trends in the various cargo types throughputs. Figure 4 reflects the year-by-year comparison amongst the cargo types. The various cargo types include containerized and general cargo. The cargo handling efficiencies at Zanzibar port between 2015 and 2016 display significant fluctuations in both general cargo and container throughput, highlighting periods of growth, instability, and recovery. Container throughput experienced a moderate increase of 2.2% from 2015 to 2016, followed by a decline of 4.5% in 2017. A substantial recovery took place in 2018, with an increase to 10.6%, and a slight rise to 1.8% was observed in 2019, indicating a brief recovery phase. However, in 2020, throughput saw a considerable drop to 16.9%, likely reflecting major disruptions due to the COVID-19 pandemic. A recovery commenced in 2021 with a growth of 2.6%, which strengthened further in 2022 with an increase of 6.7%, and continued into 2023 with an 8.4% rise. This positive trend faced a setback in 2024 with a steep decline of 45.3%, likely attributed to structural adjustments linked to a private partnership. In 2025, there was a recovery to 106.0%, marking the peak level achieved throughout the study period.
In general cargo, there is a notable and persistent upward trajectory, although some fluctuations are present. The tonnage steadily rose from 371 tons in 2015 to 446 tons in 2017, before experiencing a slight decline of 2.9% in 2018 and 9.7% in 2019. A significant increase occurred in 2020, soaring by 50.1%, and this upward trend continued into 2021 with an increase of 89.4%. The growth further accelerated in 2022, reaching 2,370 tons, which represents a 113.1% increase, followed by a minor decline of 8.2% in 2023 and a more substantial drop of 47.4%. projected for 2024 with a similar container throughput. Mirroring the container throughput, general cargo also experienced a strong rebound in 2025, achieving a remarkable 165.2% increase to 3,034 tons, the highest value observed throughout the entire study analysis.
The analysis demonstrates that container throughput exhibited significant volatility, characterized by sharp declines and subsequent recoveries, whereas general cargo followed a sustained growth trajectory with notable surges in recent years. This divergence in trends indicates distinct operational dynamics and demand patterns between containerized and conventional cargo segments at Zanzibar Port.
Source: Author’s Fieldwork
4.3. Trends in Ship Calls at Zanzibar Port
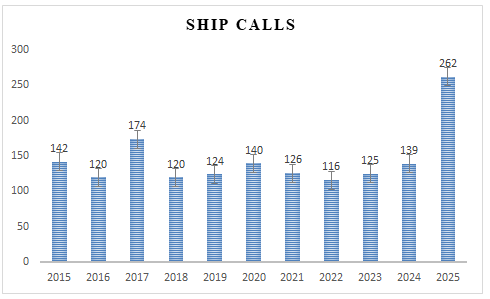
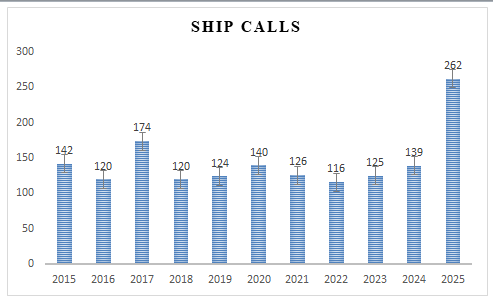
The trends of vessel visits at Zanzibar Port (Malindi Port) showed fluctuations during the study periods. In 2022, the number of vessel calls fell to 116, indicating a decrease of 7.94% from the previous year. In 2016, the decline was 15.49%, while in 2018, there was a significant drop of 31.03%, which represents the highest decrease observed throughout this analysis. By 2025, Zanzibar Port experienced an impressive increase of 88.5% in vessel visits, likely due to ongoing modernization efforts. Nonetheless, the fluctuations observed and the low number of ship visits at this port are mainly influenced by structural limitations, such as insufficient draught and a limited number of berths.
Source: Author’s Calculation
4.4 Malmquist Productivity Index-DEA Calculations
Under DEA -MPI, two aspects are mainly considered, which are technical efficiency (efficiency catch-up) and technological change (boundary shift). Hence, the product of these two aspects is known as the Malmquist Productivity Index (MPI).
4.4.1 Efficiency Change
Efficiency Change in one way is connected to managerial efficiency that may lead the movement to either downward or upward on the production frontier. Hence, the efficiency of Malindi Port at Zanzibar shown over the years, so its efficiency level remains to be constant. This shows that the port consistently functioned on the efficiency frontier, with no indication of either improvements or declines in relative efficiency. The findings imply a stable level of operational and managerial performance, indicating an effective use of available resources. Nevertheless, the lack of changes in efficiency also implies that there has been no catch-up effect over time. Table 4 below shows the results.
| Zanzibar Port | 2015 -2016 | 2016 -2017 | 2017 -2018 | 2018 -2019 | 2019 -2020 | 2020 -2021 | 2021 -2022 | 2022 -2023 | 2023-2024 | 2024-2025 |
| Efficiency Change | 1 | 1 | 1 | 1 | 1 | 1 | 1 | 1 | 1 | 1 |
Source: Author’s Calculation
4.4.2 Technological Change
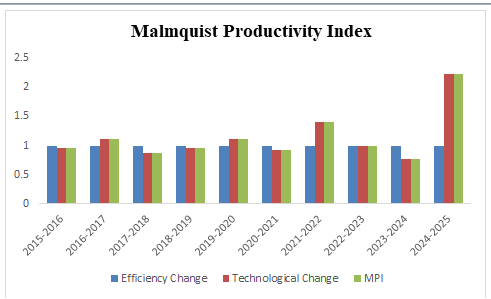
Technological change represents one aspect of the Malmquist Productivity Index. Accordingly, the technological change (TC) at Zanzibar Port was analysed over an 11-year period. Typically, TC results in an outward shift of the production frontier. The analysis revealed that the technological trajectory of Zanzibar Port was nonlinear and volatile. In 2015, 2016, and 2018, TC values were less than 1, indicating regression. In contrast, 2017 exhibited a TC greater than 1, reflecting a temporary improvement. TC remained approximately constant at 1 in other years. A moderate recovery was observed prior to the pandemic in 2018-2019, with TC exceeding 1, followed by a slight reduction during the COVID-19 period when TC fell below 1. However, TC rebounded in 2021-2022, again surpassing 1, suggesting an adaptive response. Post-pandemic, TC remained nearly stagnant, with values below 1 from 2022 to 2023, and experienced a sharp decline in 2024. The period of 2024-2025 marks a substantial outward shift in the production frontier, indicating a dramatic technological leap, possibly associated with port modernization initiatives under Africa Global Logistics.
| Zanzibar Port | 2015 -2016 | 2016 -2017 | 2017 -2018 | 2018 -2019 | 2019 -2020 | 2020 -2021 | 2021 -2022 | 2022 -2023 | 2023-2024 | 2024-2025 |
| Technological Change | 0.957 | 1.117 | 0.873 | 0.966 | 1.117 | 0.923 | 1.401 | 0.998 | 0.765 | 2.236 |
Source: Author’s Calculation
4.5 Malmquist Productivity Index
This aspect determines the driver of port productivity at the Zanzibar port. The driver of port productivity at the container terminal of Zanzibar port (Malindi Port) is driven by Technological Change. Hence, the product of efficiency changes and technological change is MPI. When indicates consistency, when shows a decline in productivity, and when signifies there is a progress in productivity. From this analysis, in the years between 2015 and 2016, there was a moderate decrease in productivity at Zanzibar Port, with TFPCH recorded at 0.957, indicating a 4.3% drop in technological advancement. This indicates a slight inward movement from the frontier, although all units continued to operate at full efficiency. Between 2016 and 2017, a notable recovery was observed, as TFCH rose to 1.77, representing a 17.7% enhancement in productivity that was entirely fuelled by technological innovation, implying a temporary extension of the frontier.
Despite an initial improvement between 2017 and 2018, the MPI fell below 1, leading to a significant drop in productivity to 0.873, which reflects a 12.7% contraction. This was followed by a continued but less severe decline in the year 2018-2019, with TFPCH reaching 0.966, indicating a 3.4% decrease. These successive declines point to a period of technological regression or stagnation. This likely suggests structural limitations instead of operational inefficiencies.
A recovery phase is observed in the 2019-2020 period, with TFPCH increasing to 1.117, indicating an 11.7% rise in productivity in line with renewed technological advancements. However, this was succeeded by another decline in 2020-2021, where TFPCH decreased to 0.923, representing a 7.7% drop. This decline can be attributed to the external global shock caused by the COVID-19 pandemic, which disrupted global supply chains and resulted in reduced exports.
A significant turning point is observed in 2021-2022, as the Malmquist Productivity Index (MPI) exceeds 1 and the Total Factor Productivity Change (TFPCH) rises sharply to 1.401, indicating a 40.1% productivity gain. This outcome suggests a pronounced outward shift of the production frontier, likely resulting from major technological or infrastructural advancements. In contrast, the 2022-2023 period exhibits near stagnation, with an MPI below 1 and a decline in TFPCH to 0.998, indicating that productivity remained largely unchanged.
A significant decline is observed in 2023-2024, with the Malmquist Productivity Index (MPI) falling below 1 and the Total Factor Productivity Change (TFPCH) decreasing sharply to 0.765, indicating a 23.5% reduction in productivity. This notable reduction likely reflects transitional disruptions and adjustment costs associated with structural changes in port systems. Notably, this period coincides with the establishment of a partnership between Zanzibar Port Corporation and African Global Logistics (Zanzibar Multipurpose Terminal), aimed at modernizing port operations. Large-scale transitions of this nature frequently result in short-term inefficiencies.
This interpretation is further supported in the subsequent period, from 2024 to 2025, when the Malmquist Productivity Index (MPI) exceeded previous values, indicating that the Total Factor Productivity Change (TFPCH) increased significantly to 2.236, corresponding to a 123.6% rise in productivity. This notable improvement reflects a substantial outward shift of the production frontier, aligning with the anticipated benefits of the modernization initiative. The magnitude of this increase suggests that partnership-driven investments, including infrastructure upgrades, improved cargo handling, and advanced technologies, have begun to yield measurable improvements in overall productivity.
| Year | Efficiency Change | Technological Change | MPI |
| 2015-2016 | 1 | 0.957 | 0.957 |
| 2016-2017 | 1 | 1.117 | 1.117 |
| 2017-2018 | 1 | 0.873 | 0.873 |
| 2018-2019 | 1 | 0.966 | 0.966 |
| 2019-2020 | 1 | 1.117 | 1.117 |
| 2020-2021 | 1 | 0.923 | 0.923 |
| 2021-2022 | 1 | 1.401 | 1.401 |
| 2022-2023 | 1 | 0.998 | 0.998 |
| 2023-2024 | 1 | 0.765 | 0.765 |
| 2024-2025 | 1 | 2.236 | 2.236 |
Source: Author’s Calculation
Source: Author’s Calculation
5. Conclusion and Recommendation.
This study was analysing the efficiency and productivity of Zanzibar Port using MPI-DEA. The study area was at Malindi Port in Zanzibar. Malindi Port is located in Zanzibar Town (urban West Region) about 35 NM off the coast of Tanzania Mainland, Lat. 6 0 093′ South Long. 39 0 11.5′ East. Its main entry point is handling International Trade for the Islands of Zanzibar. About 95 percent of Zanzibar's imports and exports pass through this Port. The Malindi Port has the busiest passenger terminal in the East African region, handling an average of 1.5 million people per year.
Analysis of cargo trends at Zanzibar Port reveals a generally expanding trajectory over the study period, despite some variation. This pattern reflects evolving trade dynamics and demand conditions in Zanzibar. Notably, periods of growth, particularly in 2025, indicate increased throughput capacity and enhanced trade integration, which can be attributed to the involvement of a private investor (AGL) in Zanzibar. In contrast, intermittent slowdowns, particularly in 2020 and 2024, suggest operational challenges and the impact of external shocks, such as the COVID-19 pandemic, on cargo flow.
In terms of the trends by cargo category. The analysis demonstrates that container throughput exhibited significant volatility, characterized by sharp declines and subsequent recoveries, whereas general cargo followed a sustained growth trajectory with notable surges in recent years. This divergence in trends indicates distinct operational dynamics and demand patterns between containerized and conventional cargo segments at Zanzibar Port.
The trends of vessel arrivals at Zanzibar Port (Malindi Port) exhibited variations throughout the study periods. In 2022, the total number of vessel arrivals decreased to 116, reflecting a drop of 7.94% compared to the previous year. In 2016, there was a reduction of 15.49%, while 2018 saw a notable decline of 31.03%, which marked the most significant decrease recorded in the study. By 2025, Zanzibar Port saw a remarkable rise of 88.5% in vessel traffic, likely attributed to the ongoing modernization initiatives.
In terms of the drivers of the port productivity, the results show that technological change is the only factor impacting productivity dynamics at Malindi Port in Zanzibar. The Efficiency Change was consistently stable (EC=1) throughout the analysis period. This indicates a lack of catch-up effects and no significant advancements in relative operational efficiency. As a result, the change in total factor productivity is entirely attributed to shifts in the production frontier, which mirror investments in infrastructure, equipment, and technological systems rather than advancements in managerial or operational practices.
Hence, analysing port operations aims to achieve improvements in both the short and long term. Port efficiency is essential for promoting sustainability, and efficiency has become increasingly significant as ports serve as critical links between various transport modes within the global logistics chain (Osundiran &Tshehla, 2024; UNACTAD 2025). As stated by UNCTAD 2023, ports ought to regularly evaluate their performance by employing internationally accepted indicators that align with their strategies, priorities, and local circumstances. This evaluation process assists in pinpointing areas that require enhancement and setting strategic objectives. Ongoing benchmarking and performance evaluation foster transparency and effective governance.
Hence, this study recommends that the Zanzibar Port Corporation should prioritize efficiency-driven reforms in conjunction with technological advancements. While modernization is vital, equal attention should be given to enhancing operational processes, managerial practices, and workforce skills to achieve sustained productivity gains. The findings highlight the necessity for the Zanzibar Port Corporation to adopt a strategic shift toward a more balanced and sustainable performance model through an integrated approach. Ensuring the efficiency of this port will contribute to both economic growth and regional connectivity and enhance the livelihoods of island residents
References
- Almeida, M. S. de, Martins, M. C. M., Nascimento, M. V. do, & Tozi, L. A. (2026). EFICIÊNCIA DOS PRINCIPAIS TERMINAIS BRASILEIROS DE GRANÉIS SÓLIDOS: uma análise com DEA. Revista Ciências Exatas, 32(1), 1. DOI ↗ Google Scholar ↗
- Ben Mabrouk, M., & Aloulou, N. (2025). Analysis of technical efficiency with frontier techniques: The case of Tunisian ports. Journal of Maritime Research (Internet), 22(2), 421–431. DOI ↗ Google Scholar ↗
- Burns, M. G. (2014). Port Management and Operations. CRC Press. DOI ↗ Google Scholar ↗
- Chen, K.-K., Road, P.-N., Keelung, T. R. O. C., & Huang, M. (n.d.). THE COMPARISON OF ECONOMIC EFFICIENCY AMONG THE COMMERCIAL PORTS IN TAIWAN. easts.info.http://easts.info/on-line/journal/vol4no1/41027.pdf DOI ↗ Google Scholar ↗
- Coto-Millan, P., Banos-Pino, J., & Rodriguez-Alvarez, A. (2000). Economic efficiency in Spanish ports: some empirical evidence. Maritime Policy & Management, 27(2), 169–174. DOI ↗ Google Scholar ↗
- Cullinane, K. (2026). 14 estimating the productivity and efficiency of container ports and terminals. The Handbook of Maritime Economics and Business. DOI ↗ Google Scholar ↗
- Diallo, K. S., Mendy, P., Degla, G., & Ndiaye, B. M. (2022). Data envelopment analysis and bootstrap approaches for the efficiency measure of the autonomous port of Dakar. Journal of Mathematics Research, 14(4), 51–51. DOI ↗ Google Scholar ↗
- Ducruet, C., & Notteboom, T. (2023). Port Systems in Global Competition: Spatial-Economic Perspectives on the Co-Development of Seaports. Taylor & Francis. DOI ↗ Google Scholar ↗
- Dudycz, T., Osbert-Pociecha, G., & Brycz, B. (2015). The Essence and Measurement of Organizational Efficiency. Springer. DOI ↗ Google Scholar ↗
- Färe, R., Grosskopf, S., & Robert Russell, R. (2012). Index Numbers: Essays in Honour of Sten Malmquist. Springer Science & Business Media. DOI ↗ Google Scholar ↗
- Førsund, F. R. (1990). The Malmquist Productivity Index. DOI ↗ Google Scholar ↗
- Humphreys, M., Stokenberga, A., Dappe, M. H., & Hartmann, O. (2019). Port Development and Competition in East and Southern Africa: Prospects and Challenges. World Bank Publications. DOI ↗ Google Scholar ↗
- International Bank for Reconstruction and Development. (2024). The container port performance index 2023: A comparable assessment of performance based on vessel time in port. World Bank. DOI ↗ Google Scholar ↗
- Jumbe, M. A., & Mamboya, S. U. (2019). Zanzibar maritime strategy for implementing IMO instruments 2019 – 2023. Revolutionary Government of Zanzibar. DOI ↗ Google Scholar ↗
- Kombo, A. H. (2015). Analysing the impact of increasing maritime transport costs on the price of imported goods: “Case for Zanzibar” (S. Mohamed (ed.)) [Open University of Tanzania].http://repository.out.ac.tz/2413/1/ABDULLAH%20HUSSEIN%20KOMBO%20%20%20FINAL.pdf DOI ↗ Google Scholar ↗
- Liu, Z. (1995). The comparative performance of public and private enterprises: The case of British ports. Journal of Transport Economics and Policy, 29(3), 263–274. DOI ↗ Google Scholar ↗
- Mwinyi, H. A., Abdulla, H. S., Mohamed, K. S., Omar, H. H., Meza, J. A., & Khamis, A. A. (2024). Zanzibar port corporation: ZPC spotlight. Zanzibar Ports Corporation. DOI ↗ Google Scholar ↗
- Notteboom, T., Pallis, A., & Rodrigue, J.-P. (2021a). Port Economics, Management and Policy. Routledge. DOI ↗ Google Scholar ↗
- Notteboom, T., Pallis, A., & Rodrigue, J.-P. (2021b). Port Economics, Management and Policy. Routledge. DOI ↗ Google Scholar ↗
- Notteboom, T., Pallis, A., & Rodrigue, J.-P. (2026). Port economics, management, and policy. Routledge. DOI ↗ Google Scholar ↗
- (PDF) The Challenges Facing the Ports in ESA. (n.d.). DOI ↗ Google Scholar ↗
- Safuan, S. (2025). Port management and operations: A critical review of Maria G. Burns’ book. Transactions on Maritime Science, 14(1). DOI ↗ Google Scholar ↗
- Sánchez, R. J., Hoffmann, J., Micco, A., Pizzolitto, G. V., Sgut, M., & Wilmsmeier, G. (2003). Port efficiency and international trade: Port efficiency as a determinant of maritime transport costs. Maritime Economics & Logistics, 5(2), 199–218. DOI ↗ Google Scholar ↗
- Schmidt, P. (1985). Frontier production functions. Econometric Reviews, 4(2), 289–328. DOI ↗ Google Scholar ↗
- Schmidt, P., & Sickles, R. C. (1984). Production Frontiers and Panel Data. Journal of Business & Economic Statistics, 2(4), 367–374. DOI ↗ Google Scholar ↗
- The Container Port Performance Index 2020 to 2024. (n.d.). DOI ↗ Google Scholar ↗
- United Nations Conference on Trade and Development. (2025). Review of maritime transport (No. UNCTAD/RMT/2025). United Nations. DOI ↗ Google Scholar ↗
- United Nations Trade and Development (UNCTAD). (2024). Review of Maritime Transport 2024: Navigating Maritime Chokepoints. Stylus Publishing, LLC. DOI ↗ Google Scholar ↗
- VanHassel, E., Pruyn, J., & Vanelslander, T. (2024). Theo Notteboom, Athanasios Pallis, and Jean-Paul Rodrigue, Port Economics, Management, and Policy, New York: Routledge, 2022. Pp. 690. ISBN 9780367331559. WMU Journal of Maritime Affairs, 23(3), 477–480. DOI ↗ Google Scholar ↗
- Yu, M.-M. (2024). An introduction to productivity and efficiency analysis. DOI ↗ Google Scholar ↗
- 周玉涛, 李振福, & 邓昭. (2024). 环渤海地区港口效率的时空分异, 未来趋势及驱动因素研究. World Regional Studies, 33(4). DOI ↗ Google Scholar ↗